Description: Different types of graphs used in statistical analysis.
GRAPHS
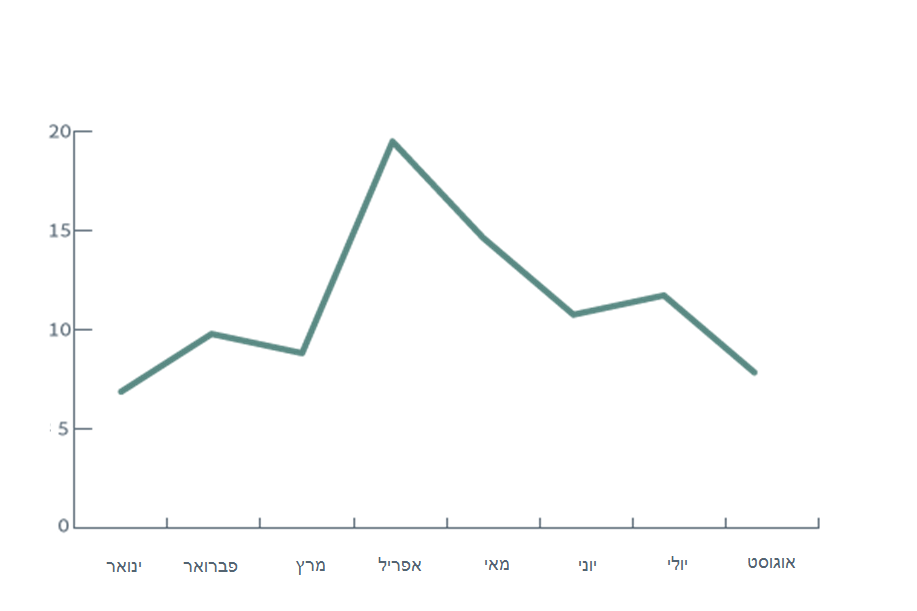
LINE GRAPH- A Line Graph is a graph that uses a line to connect data points.
- Line graphs are used to display continuous data.
- Line graphs can be useful in predicting future events when they show trends over time.
- A Line Graph is a graph that uses a line to connect data points.
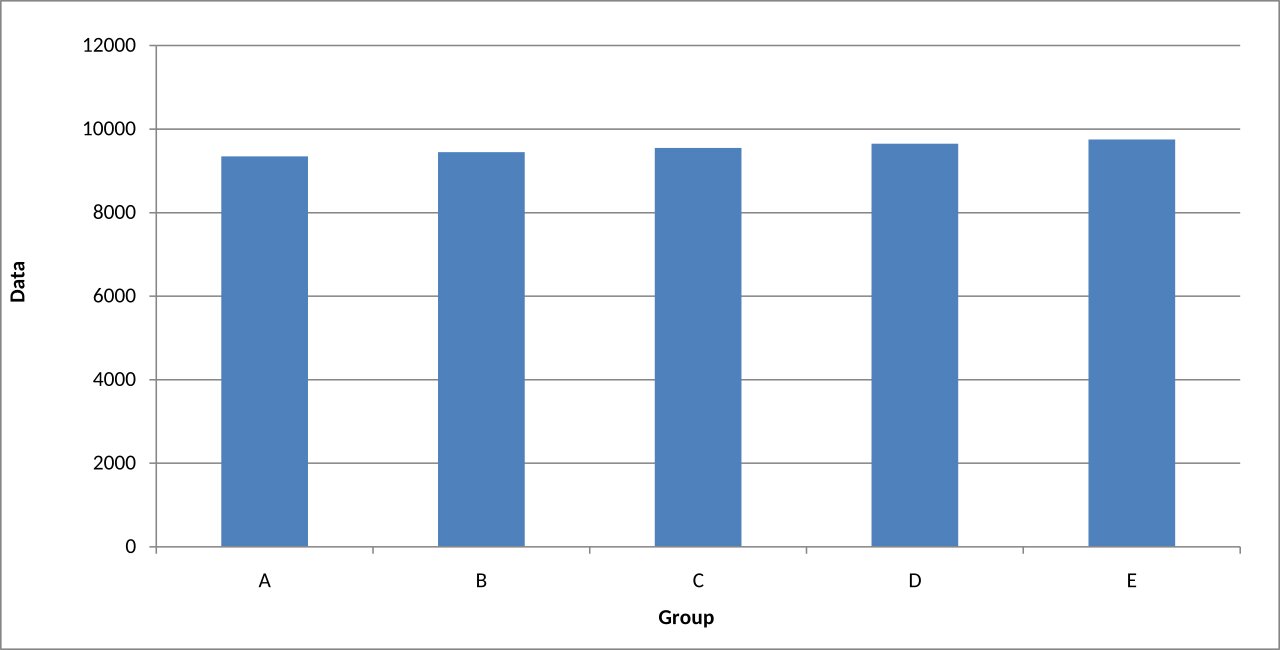
BAR GRAPH- A Bar Graph is a graph that represents data with the help of rectangular bars.
- It is used to represent categorical data.
- The lengths of the bars represent the value of the category
- It is also known as a column chart
- It can be shown vertically or horizontally
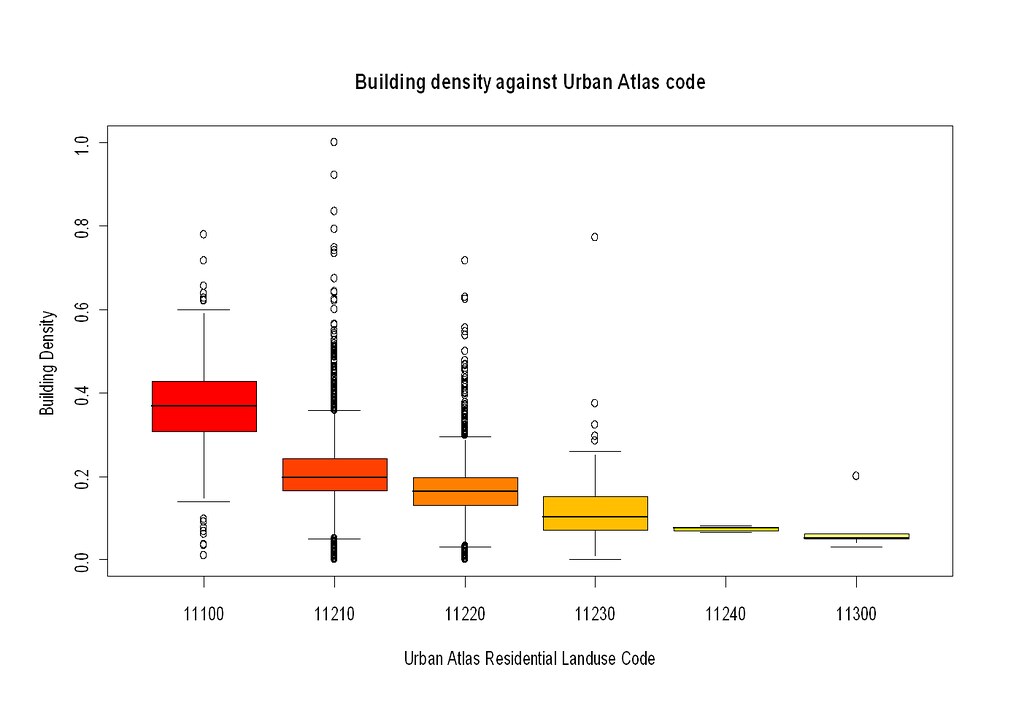
BOX PLOT- A box plot is a way of representing data on the basis of 5 number summary
- The 5 numbers in a box plot are
- A box plot also shows the presence of outliers in the data.
- It can also tell if the data is symmetrical or skewed.
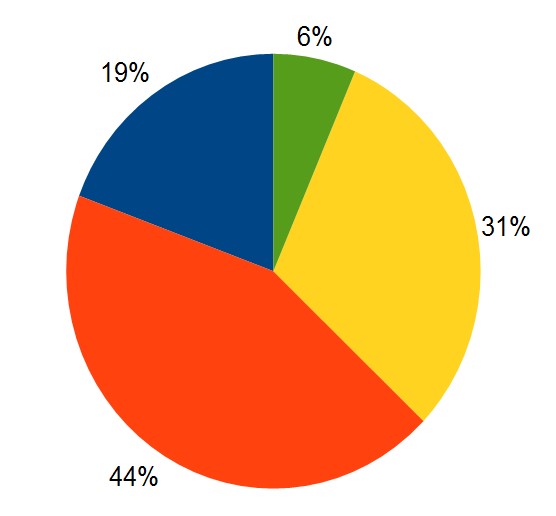
PIE CHART- A Pie Chart is a type of graph which displays data in a circular form.
- The percentage of the portion of the circle shows the size of the category.
- It is also called a Circle Graph.
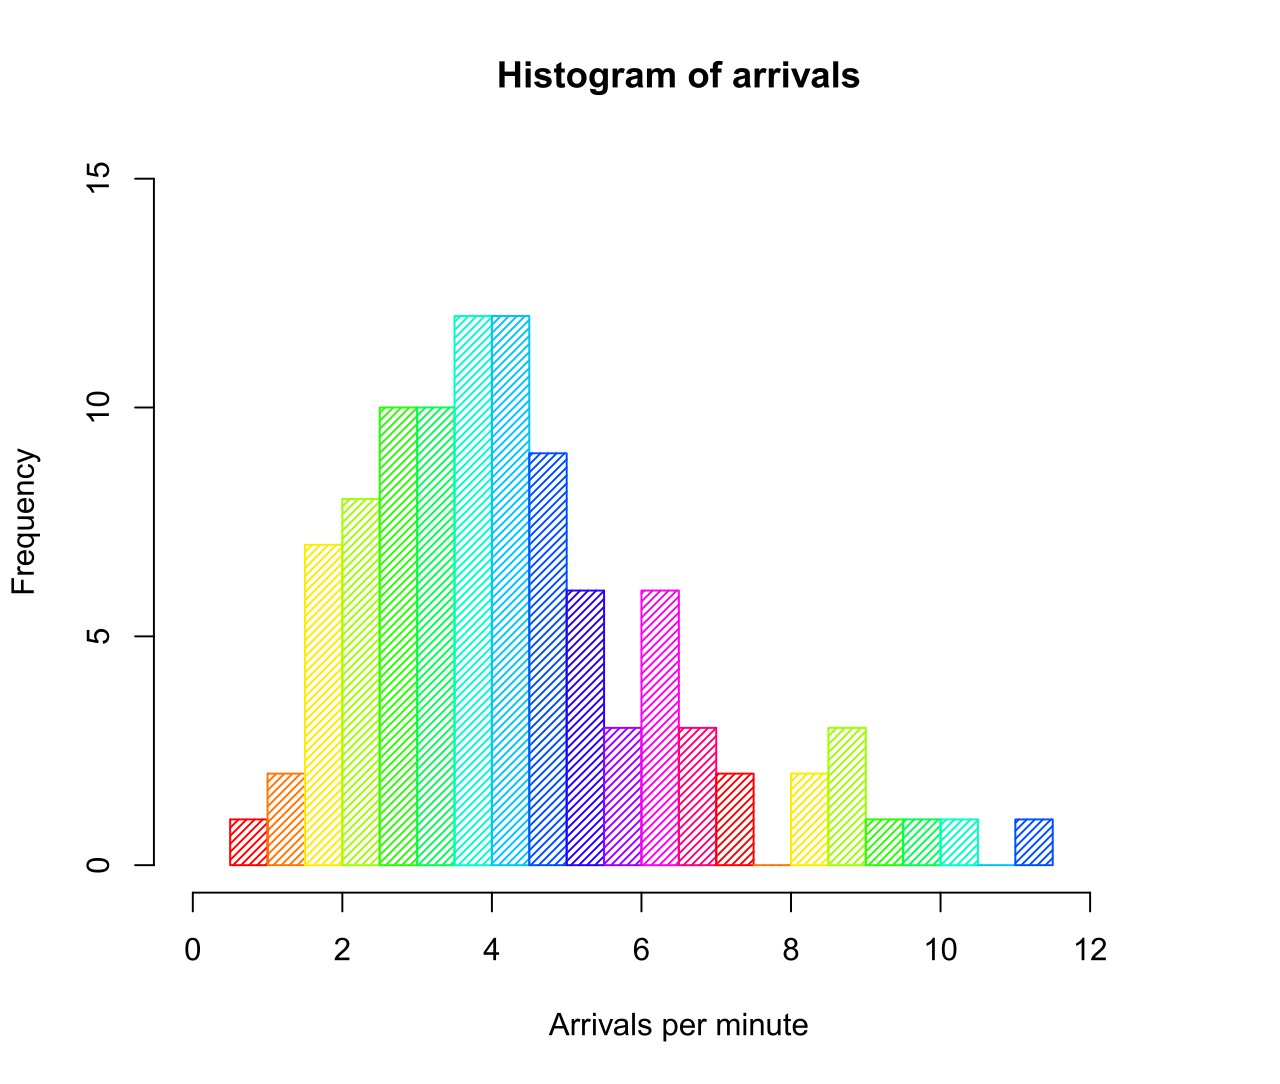
HISTOGRAM- A Histogram is a graph used to represent the frequency of a range of data using bars or columns.
- The width of the bar shows the range of data and the height shows the frequency.
- The intervals are continuous and hence there is no gap between the bars.
public Lumos Mind Maps (376 Mind maps)


Useful Links:
Sign up for a FREE Account


Microsoft
OR
Login Required
You need to Login to unlock all the features.