Lumos Video Store
This page provides a list of educational videos related to Lesson 31. You can also use this page to find sample questions, apps, worksheets, lessons , infographics and presentations related to Lesson 31.
Absolute Value | MathHelp.com
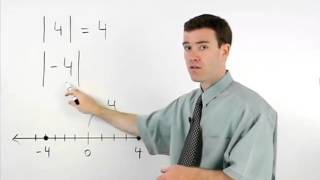
By MathHelp.com
This lesson covers histograms. Students learn that a histogram is a type of bar graph that shows the frequency of data in various intervals (such as the number of residents in a given neighborhood that are age 21-30, age 31-40, and so on). Note that the difference between a histogram and a bar graph is that in a histogram, the data is organized into intervals. Students are then asked to create histograms using given data, and answer questions based on given histograms.
How to Use "Have to" to Express Responsibilities in English

By Learn English with EnglishClass101.com


01 - Intro to Sequences (Arithmetic Sequence & Geometric Sequence) - Part 1
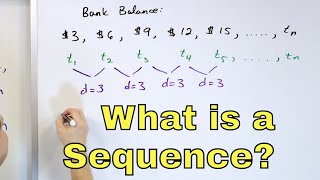
By Math and Science
Quality Math And Science Videos that feature step-by-step example problems!
02 - Solve Perfect Square Quadratic Equations Part 1

By Math and Science
Quality Math And Science Videos that feature step-by-step example problems!
01 - What is a Fraction? - Definition & Meaning - Part 1 - Numerator, Denominator & More.
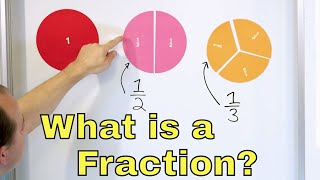
By Math and Science
Quality Math And Science Videos that feature step-by-step example problems!
Consistency, Canvas, and Templates for Elementary and Middle with Fruitvale School District

By CanvasLMS
05 - Polynomial Long Division - Part 1 (Division of Polynomials Explained)
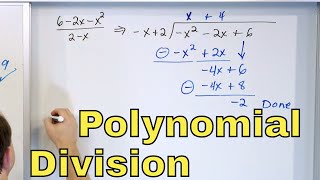
By Math and Science
Quality Math And Science Videos that feature step-by-step example problems!