Lumos Video Store
This page provides a list of educational videos related to Drawing Solids. You can also use this page to find sample questions, apps, worksheets, lessons , infographics and presentations related to Drawing Solids.
Difference of Two Cubes | MathHelp.com

By MathHelp.com
To solve the given system of inequalities, we start by graphing the associated equation for each inequality. In other words, we graph y equals -1/5 x +1 and y equals 3x + 2. So, for the first inequality, we start with our y-intercept of positive 1, up 1 unit on the y-axis. From there, we take our slope of -1/5, so we go down 1 and to the right 5, and plot a second point. Now, notice that our inequality uses a “less than” sign. This means that we draw a dotted line connecting the points, rather than a solid line. It’s important to understand that if we have a greater than sign or a less than sign, we use a dotted line, and if we have a greater than or equal to sign or a less than or equal to sign, we use a solid line. Pay close attention to this idea when drawing your lines. Students often carelessly use a solid line when they should use a dotted one, and vice-versa. Next, let’s take a look at our second inequality, which has a y-intercept of positive 2, up 2 units on the y-axis. From there, we take our slope of 3, or 3 over 1, so we go up 3 and to the right 1, and plot a second point. And notice that this inequality uses a “greater than or equal to” sign, so we connect the points with a solid line, rather than a dotted line. Next, we need to determine which side of each of these lines to shade on the graph. To determine which side of our first line to shade, we use a test point on either side of the first line. The easiest test point to use is (0, 0), so we plug a zero into our first inequality for both x and y, and we have 0 is less than -1/5 times 0 + 1, which simplifies to 0 is less than 0 + 1, or 0 is less than 1. Notice that 0 is less than 1 is a true statement. This means that our test point, (0, 0), is a solution to the first inequality, so we shade in the direction of (0, 0) along our first boundary line. Next, we determine which side of our second line to shade by using a test point on either side of the second line, such as (0, 0). Plugging a zero into our second inequality for both x and y, we have 0 equal to 3 times 0 + 2, which simplifies to 0 equal to 0 + 2, or 0 equal to 2. Notice that 0 equal to 2 is a false statement. This means that our test point, (0, 0), is a not solution to the inequality, so we shade away from (0, 0) along our second boundary line. Finally, it’s important to understand that the solution to this system of inequalities is represented by the part of the graph where the two shaded regions overlap, which in this case is in the lower left. In other words, any point that lies in this part of the graph is a solution to the given system of inequalities. Note that the points along the dotted boundary line of this region are not solutions to the system, but the points along the solid boundary line of this region are solutions to the system.

Symmetry of two-dimensional shapes
By Khan Academy
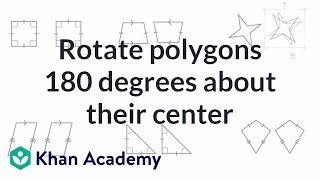
Sal checks whether various figure are symmetrical under a 180 degrees rotation.
Symmetry of two-dimensional shapes
By Khan Academy
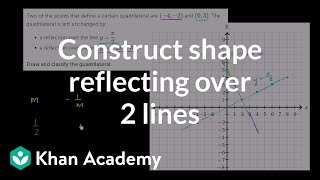
Sal solves the following problem: Two of the points that define a certain quadrilateral are (-4,-2) and (0,5). The quadrilateral has a������������reflective symmetry over the lines y=x/2 and������������y=-2x + 5.������������Draw and classify the quadrilateral.
Symmetry of two-dimensional shapes
By Khan Academy
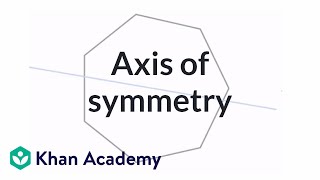
Sal introduces the concept of an axis of symmetry.,1332
Symmetry of two-dimensional shapes
By Khan Academy
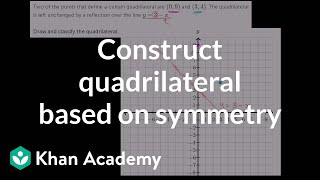
Sal solves the following problem: Two of the points that define a certain quadrilateral are (0,9) and (3,4). The quadrilateral has reflective symmetry over the line y=3-x. Draw and classify the quadrilateral.
Geometry construction draw parallel lines
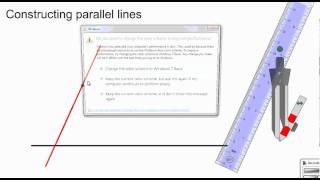
By Soowook Lee
Youtube Presents Geometry construction draw parallel lines an educational video resources on math.

Statistics: Parallel Boxplots (Univariate Data)

By Educator
Watch more at http://www.educator.com/mathematics/statistics/yates/ Other subjects include Calculus, Biology, Chemistry, Physics, Algebra 1/2, Basic Math, Trigonometry, Pre-Calculus, Geometry, Pre-Algebra, Organic Chemistry, and Computer Science. -All lectures are broken down by individual topics -No more wasted time -Just search and jump directly to the answer


What is Volume in Math? Calculate Volume of Rectangular Prisms & Cubes w/ Units - [5-8-13]
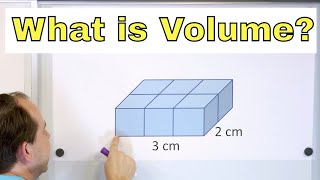
By Math and Science
Quality Math And Science Videos that feature step-by-step example problems!

Optical Activity - Specific Rotation & Enantiomeric Excess - Stereochemistry Youtube
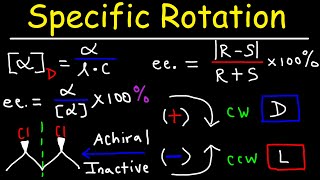
By The Organic Chemistry Tutor
This organic chemistry video tutorial explains how to calculate the specific rotation of an enantiomer given the observed rotation, the pathlength, and the concentration of the solution. It discusses how to determine if a molecule will show optical activity based on its chirality. It also provides the formulas needed to calculate the optical purity and enantiomeric excess. Those formulas can be used to calculate the relative percentages of the R and S isomers.

Stereochemistry - R S Configuration & Fischer Projections
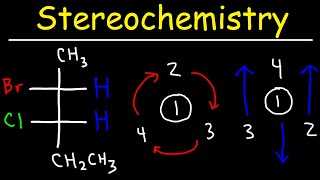
By The Organic Chemistry Tutor
This video provides an overview of the stereochemistry of organic compounds and defines what exactly a chiral carbon center is. This video also shows you how to assign R and S configuration to a chirality center whenever the hydrogen (4th group) atom is in the front, back, or neither. It also discusses nomenclature - how to name organic compounds using R and S absolute configuration. It provides a lot of examples and practice problems.