Lumos Video Store
This page provides a list of educational videos related to Connect the Dots. You can also use this page to find sample questions, apps, worksheets, lessons , infographics and presentations related to Connect the Dots.
Third Grade Reading Lesson 3- Fullerton Learning Centers

By Connect the Dots Learning, LLC
This video will teach your child how to read some " must-know " words for third grade in this reading lesson. Connect the Dots Learning is a full service learning center in Fullerton CA. Feel free to share this video =) it's free. #readingisfun #readingisfundamental #readinglist #thirdgrade #commoncore
Difference of Two Cubes | MathHelp.com

By MathHelp.com
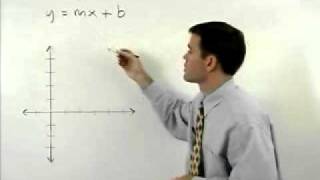
To solve the given system of inequalities, we start by graphing the associated equation for each inequality. In other words, we graph y equals -1/5 x +1 and y equals 3x + 2. So, for the first inequality, we start with our y-intercept of positive 1, up 1 unit on the y-axis. From there, we take our slope of -1/5, so we go down 1 and to the right 5, and plot a second point. Now, notice that our inequality uses a “less than” sign. This means that we draw a dotted line connecting the points, rather than a solid line. It’s important to understand that if we have a greater than sign or a less than sign, we use a dotted line, and if we have a greater than or equal to sign or a less than or equal to sign, we use a solid line. Pay close attention to this idea when drawing your lines. Students often carelessly use a solid line when they should use a dotted one, and vice-versa. Next, let’s take a look at our second inequality, which has a y-intercept of positive 2, up 2 units on the y-axis. From there, we take our slope of 3, or 3 over 1, so we go up 3 and to the right 1, and plot a second point. And notice that this inequality uses a “greater than or equal to” sign, so we connect the points with a solid line, rather than a dotted line. Next, we need to determine which side of each of these lines to shade on the graph. To determine which side of our first line to shade, we use a test point on either side of the first line. The easiest test point to use is (0, 0), so we plug a zero into our first inequality for both x and y, and we have 0 is less than -1/5 times 0 + 1, which simplifies to 0 is less than 0 + 1, or 0 is less than 1. Notice that 0 is less than 1 is a true statement. This means that our test point, (0, 0), is a solution to the first inequality, so we shade in the direction of (0, 0) along our first boundary line. Next, we determine which side of our second line to shade by using a test point on either side of the second line, such as (0, 0). Plugging a zero into our second inequality for both x and y, we have 0 equal to 3 times 0 + 2, which simplifies to 0 equal to 0 + 2, or 0 equal to 2. Notice that 0 equal to 2 is a false statement. This means that our test point, (0, 0), is a not solution to the inequality, so we shade away from (0, 0) along our second boundary line. Finally, it’s important to understand that the solution to this system of inequalities is represented by the part of the graph where the two shaded regions overlap, which in this case is in the lower left. In other words, any point that lies in this part of the graph is a solution to the given system of inequalities. Note that the points along the dotted boundary line of this region are not solutions to the system, but the points along the solid boundary line of this region are solutions to the system.


Learn Graphing, Coordinate Plane, Points, Lines, X-Axis, Y-Axis & Ordered Pairs - [5-7-1]

By Math and Science
Quality Math And Science Videos that feature step-by-step example problems!


Autism: An evolutionary perspective, Professor Simon Baron-Cohen, 1st Symposium of EPSIG, 2016

By Lumos Learning
First Symposium of the Evolutionary Psychiatry Special Interest Group of the Royal College of Psychiatrists, Oct 4th 2016 in London. Lecture by Professor Simon Baron-Cohen from Cambridge University Autism Research Centre.
