When to Use Bar Charts. Episode 1. Which Chart Or Graph Is Right for You? - By Tableau Software
| 00:0 |
DESCRIPTION:
Transforming data into an effective visualization (any kind of chart or graph) is the first step towards making your data work for you. In this video learn best practices for using a bar chart.
OVERVIEW:
When to Use Bar Charts. Episode 1. Which Chart Or Graph Is Right for You? is a free educational video by Tableau Software.It helps students in grades 3 practice the following standards 3.MD.B.3.
This page not only allows students and teachers view When to Use Bar Charts. Episode 1. Which Chart Or Graph Is Right for You? but also find engaging Sample Questions, Apps, Pins, Worksheets, Books related to the following topics.
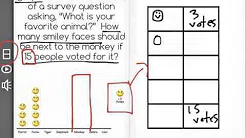
1. 3.MD.B.3 : Draw a scaled picture graph and a scaled bar graph to represent a data set with several categories. Solve one- and two-step "how many more" and "how many less" problems using information presented in scaled bar graphs. For example, draw a bar graph in which each square in the bar graph might represent 5 pets..

")
")
")
")