[3.MD.4-1.0] Visual Representations of Data - Common Core Standard - By Freckle education
| 00:0 |
DESCRIPTION:
Generate measurement data by measuring lengths using rulers marked with halves and fourths of an inch.
OVERVIEW:
[3.MD.4-1.0] Visual Representations of Data - Common Core Standard is a free educational video by Freckle education.It helps students in grades 3 practice the following standards 3.MD.B.3.
This page not only allows students and teachers view [3.MD.4-1.0] Visual Representations of Data - Common Core Standard but also find engaging Sample Questions, Apps, Pins, Worksheets, Books related to the following topics.
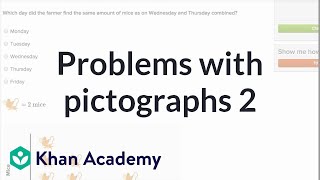
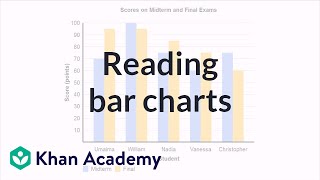
1. 3.MD.B.3 : Draw a scaled picture graph and a scaled bar graph to represent a data set with several categories. Solve one- and two-step "how many more" and "how many less" problems using information presented in scaled bar graphs. For example, draw a bar graph in which each square in the bar graph might represent 5 pets..

")
")
")
")