Lumos Video Store
This page provides a list of educational videos related to As Time Goes By. You can also use this page to find sample questions, apps, worksheets, lessons , infographics and presentations related to As Time Goes By.

non-fiction text structures

By Dana Carlton
In the first half of this slide show, the teacher defines six text structures, then in the second half goes over text examples. The whole presentation happens in the real time of a classroom so there is side talk and student responses along with the instruction. Also, it goes slowly, taking 20 minutes. Play a brief definition of one structure with these time signatures: Chronological (1:29), Cause/Effect (2:47), Compare/Contrast (5:06), Problem/Solution (6.06), Sequence/Process (7:11), and Spatial/Descriptive (9:02).

"The Odyssey" CONTEXT

By 60 Second Recap
If you're having trouble understanding some of the stuff that goes on in "The Odyssey"—like maybe all the characters with superhuman characteristics, and all the references to gods who meddle in human affairs—then you might want to know something about the time in which Homer was writing his epic poem
"The Odyssey" CONTEXT
By 60 Second Recap
If you're having trouble understanding some of the stuff that goes on in "The Odyssey"—like maybe all the characters with superhuman characteristics, and all the references to gods who meddle in human affairs—then you might want to know something about the time in which Homer was writing his epic poem.
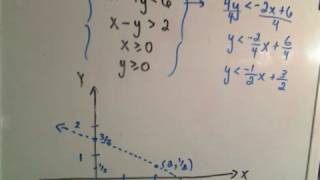
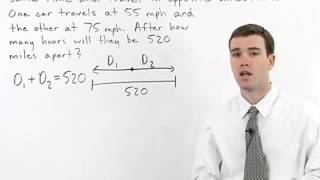
Graphing Systems of Linear Inequalities - Example 2
By PatrickJMT
In this video, the instructor goes through the steps needed to graph a system of linear inequalities. He discusses slope, shows how to draw the line on the coordinate plane, and explains what section of the graph should be shaded. There is some shadow on the white board which makes it a little more difficult to see at times during the instruction.


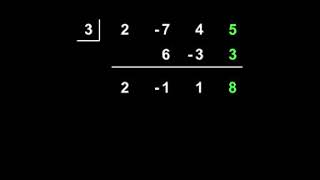
Synthetic Division | MathHelp.com
By MathHelp.com
In this example, it’s tempting to divide x squared + 5x – 6 by x + 1 by first factoring x squared + 5x – 6. The factors of -6 that add to positive 5 are +6 and -1, so we have x + 6 times x – 1 over x + 1. Notice, however, that nothing cancels. In this situation, we need a different method of dividing the polynomials, so we use long division. In other words, we rewrite x squared + 5x – 6 divided by x + 1 as x + 1 divided into x squared + 5x – 6. Now, our first step in the long division is to determine how many times x goes into x squared. Since x goes into x squared x times, we write an x above the x squared, just like we do with regular long division. Next, we multiply the x times the x + 1 in the divisor to get x squared + x, and we write the x squared + x underneath the x squared + 5x. Next, we subtract x squared + x from x squared + 5x. And watch out for this step: it’s an area where most of the common mistakes in these types of problems are made. Instead of subtracting, I would change the sign of each term in x squared + x, so we have negative x squared + negative x, then add the columns. So we have x squared + negative x squared, which cancels out, and positive 5x + negative x, which is positive 4x. Next, we bring down the -6, in regular long division. Now, we need to determine how many times x goes into 4x. Since x goes into 4x 4 times, we write a positive 4 in our answer. Next, we multiply positive 4 times x + 1 to get 4x + 4, and we write the 4x + 4 underneath the 4x – 6. Next, we subtract 4x + 4 from 4x – 6. In other words, we change the signs on 4x + 4 to -4x + -4, and we add. 4x + -4x cancels out, and -6 + -4 is -10. And since there are no other numbers to bring down, we have a remainder of -10. Finally, remember from the previous example that we add the remainder over the divisor to the quotient. In other words, we add -10 over x + 1 to x + 4, and we have x + 4 + -10 over x + 1. So x squared + 5x – 6 divided by x + 1 simplifies to x + 4 + -10 over x + 1.
Finding One Variable Statistics With a Graphing Calculator

By YouTube (Firm)
This quick YouTube video from high school statistics teacher Roger W. Davis explains how to find one variable statistics using the TI-84 graphing calculator. The demonstration goes through three steps: entering the data, finding one variable statistics using the STAT menu, and interpreting the results. The data created includes mean, sum, median and more. Flash player is required to view this video, and the running time for the clip is 3:12.
