Lumos Video Store
This page provides a list of educational videos related to Understanding Slope. You can also use this page to find sample questions, apps, worksheets, lessons , infographics and presentations related to Understanding Slope.
Equation of a Line With an Undefined Slope

By Stephen Day
Understand the relationship between dividing by 0 and undefined slopes.
Derivative as slope of a tangent line | Taking derivatives | Differential Calculus

By Khan Academy
Calculus-Derivative: Understanding that the derivative is just the slope of a curve at a point (or the slope of the tangent line). All Khan Academy content is available for free at www.khanacademy.org
Calculus: Derivatives 1 (new HD version)
By Khan Academy
Calculus-Derivative: Understanding that the derivative is just the slope of a curve at a point (or the slope of the tangent line). All Khan Academy content is available for free at www.khanacademy.org


How to Graph Equations with Slope Intercept Form

By Joel Walkley
YouTube presents How to Graph Equations with Slope Intercept Form, an educational video resource on math.
Qtr 2, Lesson 5: Graphing Linear Equations in Slope-Intercept Form

By Stan Lisle
This lesson teaches about Slope - Intercept Form, and how to use this form to graph equations, or to determine the equation of lines. The video contains questions after each section to help guide the student through the lessons.
Velocity Time Graphs, Acceleration & Position Time Graphs - Physics

By The Organic Chemistry Tutor
This physics video tutorial provides a basic introduction into motion graphs such as position time graphs, velocity time graphs, and acceleration time graphs. It explains how to use area and slope to calculate the velocity, acceleration, displacement, and whether if the particle is speeding up or slowing down. It also explains how to determine if the velocity is increasing or if the acceleration is positive.
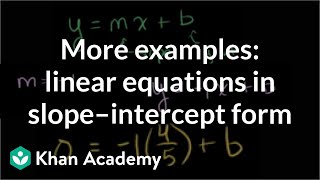
More examples of constructing linear equations in slope-intercept form | Algebra I | Khan Academy
By Khan Academy
Watch this video to learn how to derive and graph a linear equation from either: two points on the line the y-intercept and the slope A linear equation (in slope intercept form) is a line of the form y = mx + b where m is the slope and b is the y-intercept--the value at which the line intersects the y-axis.
01 - Direct Variation and Proportion in Algebra - Part 1 (Constant of Variation & More)

By Math and Science
Quality Math And Science Videos that feature step-by-step example problems!
Difference of Two Cubes | MathHelp.com

By MathHelp.com
To solve the given system of inequalities, we start by graphing the associated equation for each inequality. In other words, we graph y equals -1/5 x +1 and y equals 3x + 2. So, for the first inequality, we start with our y-intercept of positive 1, up 1 unit on the y-axis. From there, we take our slope of -1/5, so we go down 1 and to the right 5, and plot a second point. Now, notice that our inequality uses a “less than” sign. This means that we draw a dotted line connecting the points, rather than a solid line. It’s important to understand that if we have a greater than sign or a less than sign, we use a dotted line, and if we have a greater than or equal to sign or a less than or equal to sign, we use a solid line. Pay close attention to this idea when drawing your lines. Students often carelessly use a solid line when they should use a dotted one, and vice-versa. Next, let’s take a look at our second inequality, which has a y-intercept of positive 2, up 2 units on the y-axis. From there, we take our slope of 3, or 3 over 1, so we go up 3 and to the right 1, and plot a second point. And notice that this inequality uses a “greater than or equal to” sign, so we connect the points with a solid line, rather than a dotted line. Next, we need to determine which side of each of these lines to shade on the graph. To determine which side of our first line to shade, we use a test point on either side of the first line. The easiest test point to use is (0, 0), so we plug a zero into our first inequality for both x and y, and we have 0 is less than -1/5 times 0 + 1, which simplifies to 0 is less than 0 + 1, or 0 is less than 1. Notice that 0 is less than 1 is a true statement. This means that our test point, (0, 0), is a solution to the first inequality, so we shade in the direction of (0, 0) along our first boundary line. Next, we determine which side of our second line to shade by using a test point on either side of the second line, such as (0, 0). Plugging a zero into our second inequality for both x and y, we have 0 equal to 3 times 0 + 2, which simplifies to 0 equal to 0 + 2, or 0 equal to 2. Notice that 0 equal to 2 is a false statement. This means that our test point, (0, 0), is a not solution to the inequality, so we shade away from (0, 0) along our second boundary line. Finally, it’s important to understand that the solution to this system of inequalities is represented by the part of the graph where the two shaded regions overlap, which in this case is in the lower left. In other words, any point that lies in this part of the graph is a solution to the given system of inequalities. Note that the points along the dotted boundary line of this region are not solutions to the system, but the points along the solid boundary line of this region are solutions to the system.

ALL OF GRADE 9 MATH IN 60 MINUTES!!! (exam review part 2)

By Lumos Learning
Here is a great exam review video reviewing all of the main concepts you would have learned in the MPM1D grade 9 academic math course. The video is divided in to 3 parts. This is part 2: Linear Relations. In this video you will review everything there is to know about y=mx+b, scatterplots, and distance time graphs.
8th Grade Math

By Lumos Learning
8th grade math lesson addressing Common Core Standards (Massachusetts Curriculum Framework Standard 8.EE.6).
8th Grade Math

By
8th grade math lesson addressing Common Core Standards (Massachusetts Curriculum Framework Standard 8.EE.6).
03 - Inverse Variation & Joint Variation - Part 1 (Hyperbolas & Inverse Square Law)

By Math and Science
Quality Math And Science Videos that feature step-by-step example problems!
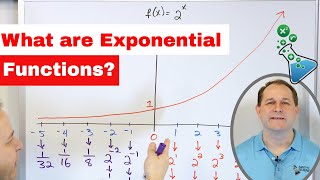
07 - What is an Exponential Function? (Exponential Growth, Decay & Graphing).
By Math and Science
Quality Math And Science Videos that feature step-by-step example problems!

Parenting a Family with Autism Spectrum Disorder (My Perfect Family: The Priestleys)

By Lumos Learning
In the Priestley family, three of four children have been diagnosed with Autism Spectrum Disorder. Though Dad, Aidan, was never diagnosed as a child - he too has come to recognise his symptoms through his children and appreciate the value that an earlier diagnosis may have had. The family are high-functioning, and many of those on the outside either don’t see or misunderstand their struggles. But behind the scenes we see the daily effort that goes into navigating the world more comfortably.