Lumos Video Store
This page provides a list of educational videos related to Graph Equations of Lines. You can also use this page to find sample questions, apps, worksheets, lessons , infographics and presentations related to Graph Equations of Lines.
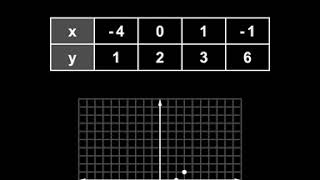
Inverse Functions | MathHelp.com
By MathHelp.com
In this example, we’re given a relation in the form of a chart, and we’re asked to find the inverse of the relation, then graph the relation and its inverse. To find the inverse of a relation, we simply switch the x and y values in each point. In other words, the point (1, -4) becomes (-4, 1), the point (2, 0) becomes (0, 2), the point (3, 1) becomes (1, 3), and the point (6, -1) becomes (-1, 6). Next, we’re asked to graph the relation and its inverse, so let’s first graph the relation. Notice that the relation contains the points (1, -4,), (2, 0), (3, 1), and (6, -1). And the inverse of the relation contains the points (-4, 1), (0, 2), (1, 3), and (-1, 6). Finally, it’s important to understand the following relationship between the graph of a relation and its inverse. If we draw a diagonal line through the coordinate system, which is the line that has the equation y = x, notice that the relation and its inverse are mirror images of each other in this line. In other words, the inverse of a relation is the reflection of the original relation in the line y = x.
Graphing Quadratic Equations
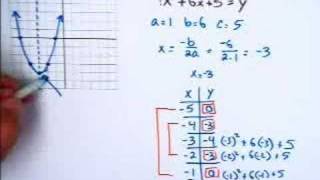
By Marc Whitaker
Instructor uses a white board to model graphing quadratic equations. Examples show using quadratic equations in standard form to determine the line of symmetry, create a table of values, and graph the quadratic equation by using these values.

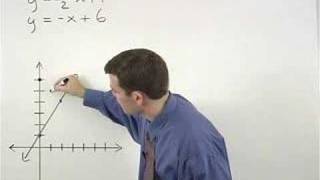
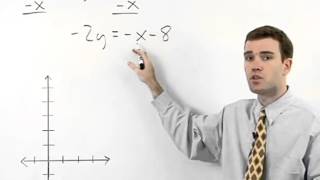
Algebra I Help: Solving Systems of Linear Equations Part II Graphing 2/3

By yourteachermathhelp
The instructor uses a white board for demonstration and this video is suitable for high school students. Students learn to solve a system of linear equations by graphing. The first step is to graph each of the given equations then find the point of intersection of the two lines which is the solution to the system of equations. If the two lines are parallel then the solution to the system is the null set. If the two given equations represent the same line then the solution to the system is the equation of that line.
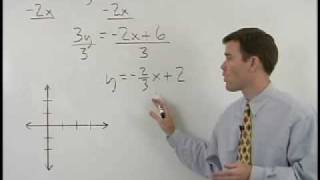
Graphing Systems of Equations Video: Graphing Systems of Equations
By yourteachermathhelp
This lesson explains how to solve a system of two equations by graphing. The instructor begins by graphing the line for each equation. Then he demonstrates how to find the point of intersection which is the solution for the system.
More examples of constructing linear equations in slope-intercept form | Algebra I | Khan Academy
By Khan Academy
Watch this video to learn how to derive and graph a linear equation from either: two points on the line the y-intercept and the slope A linear equation (in slope intercept form) is a line of the form y = mx + b where m is the slope and b is the y-intercept--the value at which the line intersects the y-axis.
Qtr 2, Lesson 5: Graphing Linear Equations in Slope-Intercept Form

By Stan Lisle
This lesson teaches about Slope - Intercept Form, and how to use this form to graph equations, or to determine the equation of lines. The video contains questions after each section to help guide the student through the lessons.


Slope-intercept equation from two solutions example | Algebra I | Khan Academy
By Khan Academy
Find the equation of a line given two points, neither of which is the y-intercept. To do this, first find the slope, then you may either graph the line (as is done here), or plug in one of the points in for "x" and "y" into y = mx + b to solve for "b."


Inverse Relations | MathHelp.com
By MathHelp.com
Here we’re asked to solve for x in the equation: log base x of 144 = 2. Notice that we have a logarithmic equation, so let’s first convert the equation to exponential form. Remember that the base of the log represents the base of the power, the right side of the equation represents the exponent, and the number inside the log represents the result, so we have x…squared…= 144. Now, to solve for x, since x is squared, we simply take the square root of both sides of the equation to get x = plus or minus 12. Remember to always use plus or minus when taking the square root of both sides of an equation. However, notice that x represents the base of the logarithm in the original problem, and the base of a logarithm cannot be negative. Therefore, x cannot be equal to negative 12. So our final answer is x = 12.


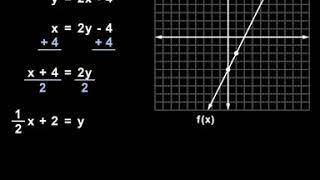
Systems of Three Equations | MathHelp.com

By MathHelp.com
Here we’re asked to graph the following function and use the horizontal line test to determine if it has an inverse. And if so, find the inverse function and graph it. So let’s start by graphing the given function, f(x) = 2x – 4, and remember that f(x) is the same as y, so we can rewrite the function as y = 2x – 4. Now, we simply graph the line y = 2x – 4, which has a y-intercept of -4, and a slope of 2, or 2/1, so we go up 2 and over 1, plot a second point and graph our line, which we’ll call f(x). Next, we’re asked to use the horizontal line test to determine if the function has an inverse. Since there’s no way to draw a horizontal line that intersects more than one point on the function, the function does have an inverse. So we need to find the inverse and graph it. To find the inverse, we switch the x and the y in original function, y = 2x – 4, to get x = 2y – 4. Next, we solve for y, so we add 4 to both sides to get x + 4 = 2y, and divide both sides by 2 to get 1/2x + 2 = y. Next, let’s flip our equation so that y is on the left side, and we have y = 1/2x + 2. Finally, we replace y with the notation that we use for the inverse function of f, as shown here. And remember that we’re asked to graph the inverse as well, so we graph y = ½ x + 2. Our y-intercept is positive 2, and our slope is ½, so we go up one and over 2, plot a second point, graph the line, and label it as the inverse function of f. Notice that the graph of the inverse function is a reflection of the original function in the line y = x.