Lumos Video Store
This page provides a list of educational videos related to Connecting Ideas. You can also use this page to find sample questions, apps, worksheets, lessons , infographics and presentations related to Connecting Ideas.
eSpark Learning: Connecting Ideas in a Text framing video (FA13, 8RI, Quest 7)

By eSparkLearningVideos
eSpark Learning: Connecting Ideas in a Text framing video (FA13, 8RI, Quest 7)
eSpark Learning: Connecting Ideas in Nonfiction Texts Instructional Video (5.RI.3)
By eSparkLearningVideos
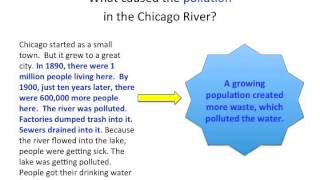
This video shows how ideas are connected in a sample text about the Chicago river, which reversed its course in 1900. It explains how two big ideas are related in the text: the reversal of the river, and the incidence of pollution. Further, the text and graphics offer a link between scientific concepts and historical events.
Road Builders by B.G. Hennessy in HD
By Bookworm Bonny
RI.2.3. Describe the connection between a series of historical events, scientific ideas or concepts, or steps in technical procedures in a text
eSpark Learning - Following Steps in a Procedure - 2.RI.3

By espark learning videos
This eSpark video outlines a new learning quest that will help students master Common Core State Standard 2.RI.3: Describe the connection between a series of historical events, scientific ideas or concepts, or steps in technical procedures in a text.
Transition words in reading and writing
By Snap Language
Transition words help writers connect ideas between sentences and paragraphs. When you read, transitions help you understand not only the ideas themselves but also the relationship between them.
eSpark Learning: Interactions of Individuals, Events and Ideas Framing Video (7.RI.3 Quest 1 FA13)

By eSparkLearningVideos
This brief introductory video explains the connections in texts that can occur between individuals, events, and ideas. It uses the election of Barack Obama in 2008 as an example.
eSpark Learning: Making Textual Connections Instructional Video (8.RI.3)

By eSparkLearningVideos
This video explains how to keep track of connections between people, events, and ideas in texts. It demonstrates several reading strategies with the example of an article about Zuckerberg, the Facebook founder. The strategies include tracing connections, asking questions, and comparing different information.
What are cohesion and coherence and how can they help you on your IELTS exam? (1 of 4)

By IELTS Ryan
This IELTS video presents the topics of cohesion and coherence. It defines cohesion as the manner in which ideas in writing connect together. Coherence is a measure of the reader's ability to clearly understand what has been written by the writer
eSpark Learning: Interactions Between Two Ideas Instructional Video (5RI3, FA13)

By eSparkLearningVideos
This video explains how readers can improve their comprehension by noticing the connections between the ideas in a text. A sample text about folding paper airplanes is read aloud and annotated to demonstrate how the ideas interact. The text and illustrations also shows the steps of a procedure- making a paper airplane- in order.
eSpark Learning: Connecting Ideas in Nonfiction Texts Instructional Video (5.RI.3)
By eSparkLearningVideos
This eSpark Learning instructional video aligns with Common Core State Standard 5.RI.3: Explain the relationships or interactions between two or more individuals, events, ideas, or concepts in a historical, scientific, or technical text based on specific information in the text.This instructional video is only one component of eSpark 's iPad-specific personalized learning systemâ€â€there's more! We streamline the best third-party apps, great educational practices and data collection into one delightful K-8 platform used to add engagement and highly differentiated Common Core aligned content to a variety of classroom settings such as early learning, 1:1 programs, intervention, Special Education and more. Interested in learning more about eSpark? Visit our website: http://www.esparklearning.com
eSpark Learning: Connecting Ideas in a Text Framing Video (Fa13, 5.RI, Quest 3)

By eSparkLearningVideos
This video briefly introduces the skill of using inference to discover how ideas in a text are related.
eSpark Learning: Connecting Ideas in a Text Framing Video (Fa13, 5.RI, Quest 3)
By eSparkLearningVideos
This video briefly introduces the skill of using inference to discover how ideas in a text are related.
What are cohesion and coherence and how can they help you on your IELTS exam? (2 of 4)

By IELTS Ryan
This IELTS video presents the topics of cohesion and coherence. It defines cohesion as the manner in which ideas in writing connect together. Coherence is a measure of the reader's ability to clearly understand what has been written by the writer. Writing with cohesion and coherence is a skill that can improve the quality of a composition.


Print Media: From Topic to Idea

By
We've talked about how to take a topic and turn it in to a pitch, and then research that story idea by interviewing sources and gathering documents. Now, a journalist is ready to write the article. In this video, we'll talk about the process of writing a story in a newspaper and the general structure of an article. Let's start with the process from draft to print.

Difference of Two Cubes | MathHelp.com

By MathHelp.com
To solve the given system of inequalities, we start by graphing the associated equation for each inequality. In other words, we graph y equals -1/5 x +1 and y equals 3x + 2. So, for the first inequality, we start with our y-intercept of positive 1, up 1 unit on the y-axis. From there, we take our slope of -1/5, so we go down 1 and to the right 5, and plot a second point. Now, notice that our inequality uses a “less than” sign. This means that we draw a dotted line connecting the points, rather than a solid line. It’s important to understand that if we have a greater than sign or a less than sign, we use a dotted line, and if we have a greater than or equal to sign or a less than or equal to sign, we use a solid line. Pay close attention to this idea when drawing your lines. Students often carelessly use a solid line when they should use a dotted one, and vice-versa. Next, let’s take a look at our second inequality, which has a y-intercept of positive 2, up 2 units on the y-axis. From there, we take our slope of 3, or 3 over 1, so we go up 3 and to the right 1, and plot a second point. And notice that this inequality uses a “greater than or equal to” sign, so we connect the points with a solid line, rather than a dotted line. Next, we need to determine which side of each of these lines to shade on the graph. To determine which side of our first line to shade, we use a test point on either side of the first line. The easiest test point to use is (0, 0), so we plug a zero into our first inequality for both x and y, and we have 0 is less than -1/5 times 0 + 1, which simplifies to 0 is less than 0 + 1, or 0 is less than 1. Notice that 0 is less than 1 is a true statement. This means that our test point, (0, 0), is a solution to the first inequality, so we shade in the direction of (0, 0) along our first boundary line. Next, we determine which side of our second line to shade by using a test point on either side of the second line, such as (0, 0). Plugging a zero into our second inequality for both x and y, we have 0 equal to 3 times 0 + 2, which simplifies to 0 equal to 0 + 2, or 0 equal to 2. Notice that 0 equal to 2 is a false statement. This means that our test point, (0, 0), is a not solution to the inequality, so we shade away from (0, 0) along our second boundary line. Finally, it’s important to understand that the solution to this system of inequalities is represented by the part of the graph where the two shaded regions overlap, which in this case is in the lower left. In other words, any point that lies in this part of the graph is a solution to the given system of inequalities. Note that the points along the dotted boundary line of this region are not solutions to the system, but the points along the solid boundary line of this region are solutions to the system.