Lumos Video Store
This page provides a list of educational videos related to Make Graphs. You can also use this page to find sample questions, apps, worksheets, lessons , infographics and presentations related to Make Graphs.
How to Make a Frequency Table

By TheMathClips
This short video demonstrates how to organize data into a frequency table, making it easier to interpret or make into a graph.
How to Make a Frequency Table
By TheMathClips
This short video demonstrates how to organize data into a frequency table, making it easier to interpret or make into a graph.
How to Make a Frequency Table
By TheMathClips
This short video demonstrates how to organize data into a frequency table, making it easier to interpret or make into a graph.
Inequalities on a number line
By Khan Academy
Learn how to graph an inequality on a number line to indicate which values make it true.
Understanding inverse trig functions

By Khan Academy
Sal is given the graph of a trigonometric function, and he discusses ways in which he can change the function to make it invertible.
Writing inequalities to describe real-world situations
By Khan Academy
Learn how to graph an inequality on a number line to indicate which values make it true.
Writing inequalities to describe real-world situations
By Khan Academy
Learn how to graph an inequality on a number line to indicate which values make it true.
Interpreting linear relationships

By Khan Academy
Sal discusses how we would go about making sense of the direction of a linear graph that represents a relationship between two real-world quantities.
Dividing line segments

By Khan Academy
Watch Sal figure out the coordinates of a point between two other points that give a certain ratio. A graph is given to make it easier to visualize the problem.
Graphing Systems of Linear Inequalities - Example 2
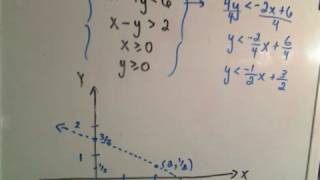
By PatrickJMT
In this video, the instructor goes through the steps needed to graph a system of linear inequalities. He discusses slope, shows how to draw the line on the coordinate plane, and explains what section of the graph should be shaded. There is some shadow on the white board which makes it a little more difficult to see at times during the instruction.
Graphing Systems of Linear Inequalities - Example 2
By PatrickJMT
In this video, the instructor goes through the steps needed to graph a system of linear inequalities. He discusses slope, shows how to draw the line on the coordinate plane, and explains what section of the graph should be shaded. There is some shadow on the white board which makes it a little more difficult to see at times during the instruction.
When to Use Bar Charts. Episode 1. Which Chart Or Graph Is Right for You?

By Tableau Software
Transforming data into an effective visualization (any kind of chart or graph) is the first step towards making your data work for you. In this video learn best practices for using a bar chart.
Constraint solution sets of two-variable linear inequalities
By Khan Academy
Sal determines which x-values make the ordered pair (x,-7) a solution of 2x-7y<25. He also solves a similar problem where the inequality is given as a graph.
Constraint solution sets of systems of linear inequalities
By Khan Academy
Given the graph of a system of inequalities, Sal finds the x-values that make the ordered pair (x,-2) a solution of the system, which is the solution set constrained to y=-2. Then he solves a similar problem where x is constrained to 4.
Functions - Domain and Range; Continuous, Discrete

By Stan Lisle
In order to get ready to graph functions, we need to make sure we understand a few concepts: domain, range, continuous functions and discrete functions. This video provides examples on all of these topics, while also providing a section of questions after each lesson.

Ex: Determine if a Function is Incr, Decr, or Constant from Graph, Table, and Ordered Pairs
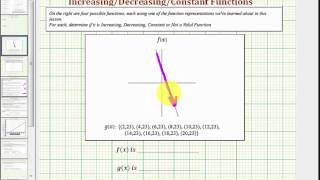
By Mathispower4u
Ex: Determine if a Function is Incr, Decr, or Constant from Graph, Table, and Ordered Pairs
Ex: Find Function Output and Input Using a Graph, Table, Ordered Pairs, and Function Rule
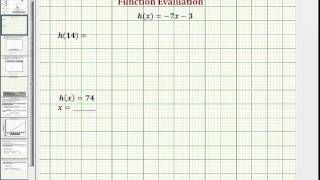
By Mathispower4u
Ex: Find Function Output and Input Using a Graph, Table, Ordered Pairs, and Function Rule
Velocity Time Graphs, Acceleration & Position Time Graphs - Physics

By The Organic Chemistry Tutor
This physics video tutorial provides a basic introduction into motion graphs such as position time graphs, velocity time graphs, and acceleration time graphs. It explains how to use area and slope to calculate the velocity, acceleration, displacement, and whether if the particle is speeding up or slowing down. It also explains how to determine if the velocity is increasing or if the acceleration is positive.
How To Graph Trigonometric Functions

By The Organic Chemistry Tutor
This trigonometry video tutorial explains how to graph sine and cosine functions using transformations, horizontal shifts / phase shifts, vertical shifts, amplitude, and the period of the sinusoidal function. This video contains many examples and practice problems on graphing trigonometric functions for you to master this topic.