Lumos Video Store
This page provides a list of educational videos related to Data in Line Plots. You can also use this page to find sample questions, apps, worksheets, lessons , infographics and presentations related to Data in Line Plots.
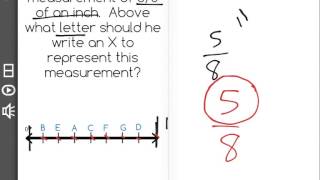
Understanding Measurement Data Displayed in Line Plots: 2.MD.9

By Tenmarks Amazon
Students learn how to interpret measurement data displayed in line plots.
[4.MD.4-1.0] Fractional Line Plots - Common Core Standard
By Freckle education
Make a line plot to display a data set of measurements in fractions of a unit (1/2, 1/4, 1/8)
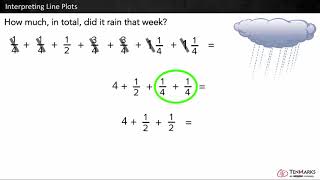
Interpreting Line plots
By Tenmarks Amazon
Students learn to interpret line plots by using the given data to answer questions involving fractions and whole numbers.
graphs and data line plot -"dot plots"

By Joann's School
Learn how to read and create a Line Plot (Dot Plot)
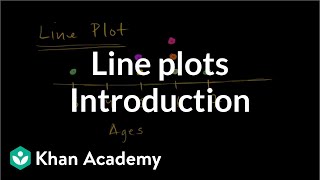
Introduction to line plots | Measurement and data | Early Math | Khan Academy
By KhanAcademy
Explanation about line plots
Creating frequency tables

By Khan Academy
In this video, we organize data into frequency tables and dot plots (sometimes called line plots).
Creating dot plots
By Khan Academy
In this video, we organize data into frequency tables and dot plots (sometimes called line plots).
Solving problems with line plots 1
By Khan Academy
Create a line plot from a set of data. ������������Use the line plot to answer questions.
Line plots and stem-and-leaf plots
By MathPlanetVideos
Construct a stem-and-leaf plot out of the following data: 6, 6,7,8,9,13,16,19,21,25,26

Stem and Leaf Plot
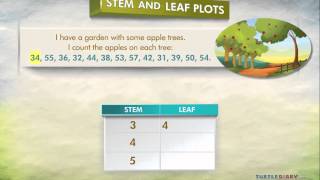
By Turtlediary
A stem and leaf plot shows a large amount of data in a clear way by listing it in order of place value. A stem and leaf plot is generally used when data has multi-digit numbers. In this kind of plot, the ones digit of each number in the data is separated from the other digits. The plot has two columns. The first column, called the “stem”, lists all of the digits in the tens place and beyond, in order. A vertical line divides the stem from the “leaves” (the second column). This second column shows the ones place of each number in the data, also in order. Every number in the leaf column represents a number from the data. Its ones place is in the leaf, and the tens place and beyond are in the stem.
Line Plots for Fractions
By Icon Math
Make line plots to display measurements in fractions of a unit.
How to read a line plot that uses fractions | 4th grade | Khan Academy
By KhanAcademy
Explanation about line plots

Statistics: Parallel Boxplots (Univariate Data)

By Educator
Watch more at http://www.educator.com/mathematics/statistics/yates/ Other subjects include Calculus, Biology, Chemistry, Physics, Algebra 1/2, Basic Math, Trigonometry, Pre-Calculus, Geometry, Pre-Algebra, Organic Chemistry, and Computer Science. -All lectures are broken down by individual topics -No more wasted time -Just search and jump directly to the answer


ALL OF GRADE 9 MATH IN 60 MINUTES!!! (exam review part 2)

By Lumos Learning
Here is a great exam review video reviewing all of the main concepts you would have learned in the MPM1D grade 9 academic math course. The video is divided in to 3 parts. This is part 2: Linear Relations. In this video you will review everything there is to know about y=mx+b, scatterplots, and distance time graphs.
