Understanding Measurement Data Displayed in Line Plots: 2.MD.9 - By Tenmarks Amazon
| 00:0 |
DESCRIPTION:
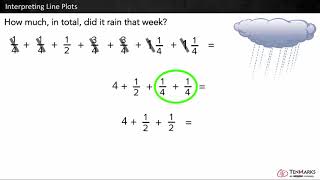
Students learn how to interpret measurement data displayed in line plots.
OVERVIEW:
Understanding Measurement Data Displayed in Line Plots: 2.MD.9 is a free educational video by Tenmarks Amazon.It helps students in grades 2 practice the following standards 2.MD.D.9.
This page not only allows students and teachers view Understanding Measurement Data Displayed in Line Plots: 2.MD.9 but also find engaging Sample Questions, Apps, Pins, Worksheets, Books related to the following topics.
1. 2.MD.D.9 : Generate measurement data by measuring lengths of several objects to the nearest whole unit, or by making repeated measurements of the same object. Show the measurements by making a line plot, where the horizontal scale is marked off in whole-number units.


")