Lumos Video Store
This page provides a list of educational videos related to Calculating the Mean. You can also use this page to find sample questions, apps, worksheets, lessons , infographics and presentations related to Calculating the Mean.
How to calculate Mean and Standard Deviation

By YouTube
YouTube presents How to calculate Mean and Standard Deviation, an educational video resource on math.
Calculating Required Sample Size to Estimate Population Mean

By statslectures
Youtube Presents Calculating Required Sample Size to Estimate Population Mean an educational video resources on english language arts.
Calculating the mean from data displays
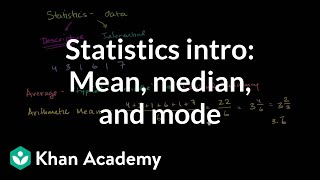
By Khan Academy
This is a fantastic intro to the basics of statistics. Our focus here is to help you understand the core concepts of arithmetic mean, median, and mode.
Finding Margin of Error

By headlessprofessor
This video discuss margin of error and how to calculate the margin of error using the mean, standard deviation, and confidence levels.
Mean and variance of Bernoulli distribution example | Probability and Statistics | Khan Academy

By Khan Academy
This video lecture series on Introduction to Statistics includes Average, Sample vs Population, Variance, Standard Deviation, Random Variables, Probability density functions, Binomial distribution, Poisson Process, Law of Large numbers and Normal Distribution.
Bernoulli distribution mean and variance formulas | Probability and Statistics | Khan Academy

By Khan Academy
This video lecture series on Introduction to Statistics includes Average, Sample vs Population, Variance, Standard Deviation, Random Variables, Probability density functions, Binomial distribution, Poisson Process, Law of Large numbers and Normal Distribution..
Confidence interval of difference of means | Probability and Statistics | Khan Academy

By Khan Academy
This video lecture series on Introduction to Statistics includes Average, Sample vs Population, Variance, Standard Deviation, Random Variables, Probability density functions, Binomial distribution, Poisson Process, Law of Large numbers and Normal Distribution.
Area - Area Of A Circle

By mrmaisonet
Once you know what 'radius' and 'area' mean, watch this video to learn how to calculate the area of a circle. Pay attention to the common mistakes, such as using an incorrect order of operations.
Standard error of the mean | Inferential statistics | Probability and Statistics | Khan Academy

By Khan Academy
This video lecture series on Introduction to Statistics includes Average, Sample vs Population, Variance, Standard Deviation, Random Variables, Probability density functions, Binomial distribution, Poisson Process, Law of Large numbers and Normal Distribution
Standard error of the mean | Inferential statistics | Probability and Statistics | Khan Academy

By Khan Academy
This video lecture series on Introduction to Statistics includes Average, Sample vs Population, Variance, Standard Deviation, Random Variables, Probability density functions, Binomial distribution, Poisson Process, Law of Large numbers and Normal Distribution.
Difference of sample means distribution | Probability and Statistics | Khan Academy

By Khan Academy
This video lecture series on Introduction to Statistics includes Average, Sample vs Population, Variance, Standard Deviation, Random Variables, Probability density functions, Binomial distribution, Poisson Process, Law of Large numbers and Normal Distribution.
Sampling Distrib. Of X Bar As Sample Size Increase Probability Increase

By ExcelIsFun
Download file: https://people.highline.edu/mgirvin/ExcelIsFun.htm Relationship Between Sample Size & Probability In Sampling Distribution of Xbar: 1. Calculations using Standard Error and NORM.DIST function to show that as sample size increases, the probability between an upper and lower value increases for the sampling distribution of Sample means or X Bar. 2. Charting Example 3. Formula Example This is for the Highline Community College Busn 210 Statistical Analysis for Business and Economics taught by Michael Girvin
Sampling Distrib. Of X Bar As Sample Size Increase Probability Increase
By ExcelIsFun
Download file: https://people.highline.edu/mgirvin/ExcelIsFun.htm Relationship Between Sample Size & Probability In Sampling Distribution of Xbar: 1. Calculations using Standard Error and NORM.DIST function to show that as sample size increases, the probability between an upper and lower value increases for the sampling distribution of Sample means or X Bar. 2. Charting Example 3. Formula Example This is for the Highline Community College Busn 210 Statistical Analysis for Business and Economics taught by Michael Girvin
Finding One Variable Statistics With a Graphing Calculator

By YouTube (Firm)
This quick YouTube video from high school statistics teacher Roger W. Davis explains how to find one variable statistics using the TI-84 graphing calculator. The demonstration goes through three steps: entering the data, finding one variable statistics using the STAT menu, and interpreting the results. The data created includes mean, sum, median and more. Flash player is required to view this video, and the running time for the clip is 3:12.

Difference of sample means distribution | Probability and Statistics | Khan Academy
By Khan Academy
This video lecture series on Introduction to Statistics includes Average, Sample vs Population, Variance, Standard Deviation, Random Variables, Probability density functions, Binomial distribution, Poisson Process, Law of Large numbers and Normal Distribution......
Inferring population mean from sample mean | Probability and Statistics | Khan Academy

By Khan Academy
Much of statistics is based upon using data from a random sample that is representative of the population at large. From that sample mean, we can infer things about the greater population mean. We'll explain.
Mean and variance of Bernoulli distribution example | Probability and Statistics | Khan Academy

By Khan Academy
This video lecture series on Introduction to Statistics includes Average, Sample vs Population, Variance, Standard Deviation, Random Variables, Probability density functions, Binomial distribution, Poisson Process, Law of Large numbers and Normal Distribution......
Confidence interval of difference of means | Probability and Statistics | Khan Academy
By Khan Academy
This video lecture series on Introduction to Statistics includes Average, Sample vs Population, Variance, Standard Deviation, Random Variables, Probability density functions, Binomial distribution, Poisson Process, Law of Large numbers and Normal Distribution......
