Lumos Video Store
This page provides a list of educational videos related to Practice with Bar Graphs. You can also use this page to find sample questions, apps, worksheets, lessons , infographics and presentations related to Practice with Bar Graphs.
When to Use Bar Charts. Episode 1. Which Chart Or Graph Is Right for You?

By Tableau Software
Transforming data into an effective visualization (any kind of chart or graph) is the first step towards making your data work for you. In this video learn best practices for using a bar chart.
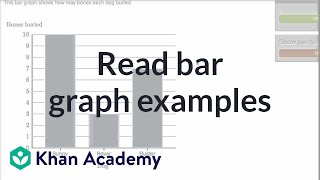
[2.MD.10-1.0] Picture and Bar Graphs - Common Core Standard

By Freckle education
Draw a picture graph and bar graph (with single-unit scale) to represent a data set with up to four categories.
Bar Graphs- Pre Algebra Help
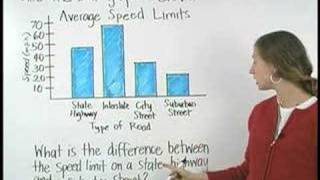
By yourteachermathhelp
Students learn that a bar graph is a visual way to display and compare numerical data (such as the population of different southern states). The bars of a bar graph are drawn in relation to a horizontal axis and a vertical axis and a bar graph can have either vertical or horizontal bars. Students are then asked to create bar graphs using given data and answer questions based on given bar graphs.
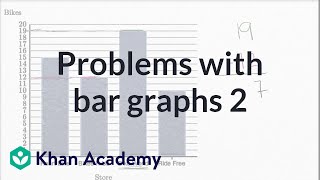
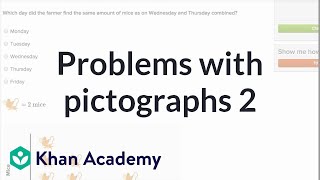
More solving problems with bar graphs | Fractions | 3rd grade

By Khan Academy
Interpret bar graphs to answer questions about a context.
Graphs for 2nd grade - pictograph and bar graph
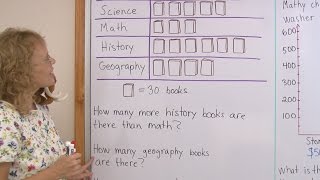
By mathmamoth
a pictograph (or a pictogram) and a bar graph. The pictograph has to do with books in a library, and one symbol of a 'book' means 30 books.
graphs and data line plot -"dot plots"

By Joann's School
Learn how to read and create a Line Plot (Dot Plot)
Building Scaled Picture Graphs: 3.MD.3

By TenMarks Amazon
Students learn the parts of a picture graph to build scaled picture graphs based on given data.
Grade 3 Math - Graphs

By Lumos Learning
Using the Lumos Study Programs, parents and educators can reinforce the classroom learning experience for children and help them succeed at school and on the standardized tests. Lumos books, dvd, eLearning and tutoring are used by leading schools, libraries and thousands of parents to supplement classroom learning and improve student achievement in the standardized tests.
Reading pictographs
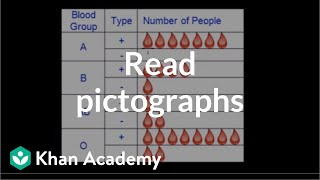
By Khan Academy
Common sense tells you that a pictograph must be some kind of....picture. Yes! A pictograph is basically a way to represent data with pictures that relate to the data. Let's look at this word problem that asks to interpret a pictograph.
Interpreting Scatterplots

By vcefurthermaths
VCE Further Maths Tutorials. Core (Data Analysis) Tutorial 17: Interpreting Scatterplots. Starts with a description of how to plot a scatterplot from a table. At the 2:24 mark it talks about how to interpret scatterplots in terms of direction form strength and outliers.
Plot and Subplots: Creative Fiction Writing

By Cy Porter
Find and map out the plot and all the subplots in your story. Work on them separately to improve your story. It's better to look at each subplot separated from the rest of the story. Use subplot to make three dimensional characters.
Statistics: Parallel Boxplots (Univariate Data)

By Educator
Watch more at http://www.educator.com/mathematics/statistics/yates/ Other subjects include Calculus, Biology, Chemistry, Physics, Algebra 1/2, Basic Math, Trigonometry, Pre-Calculus, Geometry, Pre-Algebra, Organic Chemistry, and Computer Science. -All lectures are broken down by individual topics -No more wasted time -Just search and jump directly to the answer
Examples of Creating Dot Plots

By Adam Gonzalez
This video shows us two examples of organizing data using a dot plot. Use these videos to get a better sense for how to create dot plots on your own!
Fitting quadratic and exponential functions to scatter plots
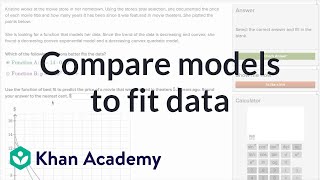
By Khan Academy
Fitting quadratic and exponential functions to scatter plots
Reading Box-and-Whisker Plots

By Khan Academy
Is this some kind of cute cat video? No! Box and whisker plots seek to explain data by showing a spread of all the data points in a sample. The "whiskers" are the two opposite ends of the data. This video is more fun than a handful of catnip.
Bar graph vs Histogram

By Alice Keeler
The difference between a histogram and a bar graph and what to consider
Interpreting dot plots with fraction operations

By Khan Academy
Given a dot plot with different measurements of trail mix in bags, find the amount of trail mix each bag would contain if the total amount in all the bags were redistributed equally.