Lumos Video Store
This page provides a list of educational videos related to Time Intervals. You can also use this page to find sample questions, apps, worksheets, lessons , infographics and presentations related to Time Intervals.
Telling Time to the Minute

By Sabrina brown
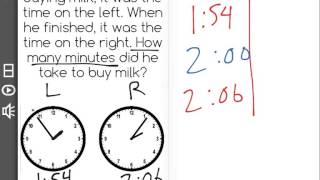
the nearest minute and measure time intervals in minutes. Solve word problems involving addition and subtraction of time intervals in minutes
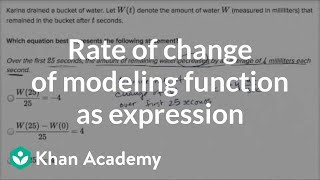
Average rate of change word problems
By Khan Academy
Sal finds the algebraic expression that represents the average rate of change of water in a drained bucket over a given time interval.
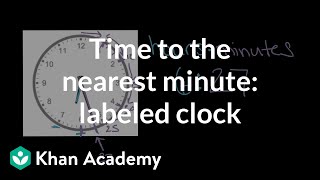
Telling time to the nearest minute: labeled clock | Math | 3rd grade | Khan Academy
By Skubes ed
problems involving addition and subtraction of time intervals in minutes, e.g., by representing the problem on a number line diagram.
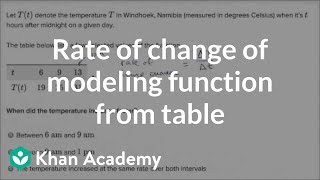
Average rate of change word problems
By Khan Academy
Sal compares the average rates of a change of a function that models temperature for different time intervals.
Histograms | MathHelp.com

By MathHelp.com
MathHelp.com offers comprehensive math tutoring for students using McGraw-Hill math textbooks. Simply select your textbook, enter your page number, and get the exact lesson you need - with a teacher!
Average rate of change word problems

By Khan Academy
Given the graph of a������������skydiver's altitude,������������Sal finds the average rate of change in altitude over a given time interval.
Work Word Problems | MathHelp.com
By MathHelp.com
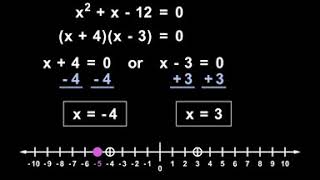
To solve a polynomial inequality, like the one shown here, our first step is to write the corresponding equation. In other words, we simply change the inequality sign to an equals sign, and we have x^2 – 3 = 9 – x. Next, we solve the equation. Since we have a squared term, we first set the equation equal to 0. So we move the 9 – x to the left side by subtracting 9 and adding x to both sides of the equation. This gives us x^2 + x – 12 = 0. Next, we factor the left side as the product of two binomials. Since the factors of negative 12 that add to positive 1 are positive 4 and negative 3, we have x + 4 times x – 3 = 0. So either x + 4 = 0 or x – 3 = 0, and solving each equation from here, we have x = -4, and x = 3. Now, it’s important to understand that the solutions to the equation, -4 and 3, represent what are called the “critical values” of the inequality, and we plot these critical values on a number line. However, notice that our original inequality uses a greater than sign, rather than greater than or equal to sign, so we use open dots on our critical values of -4 and positive 3. Remember that ‘greater than’ or ‘less than’ means open dot, and ‘greater than or equal to’ or ‘less than or equal to’ means closed dot. Now, we can see that our critical values have divided the number line into three separate intervals: less than -4, between -4 and 3, and greater than 3. And here’s the important part. Our next step is to test a value from each of the intervals by plugging the value back into the original inequality to see if it gives us a true statement. So let’s first test a value from the “less than -4” interval, such as -5. If we plug a -5 back in for both x’s in the original inequality, we have -5 squared – 3 greater than 9 minus a -5, which simplifies to 25 – 3 greater than 9 + 5, or 22 greater than 14. Since 22 greater than 14 is a true statement, this means that all values in the interval we’re testing are solutions to inequality, so we shade the interval. Next, we test a value from the “between -4 and 3” interval, such as 0. If we plug a 0 back in for both x’s in the original inequality, we have 0 squared – 3 greater than 9 – 0, which simplifies to 0 – 3 greater than 9, or -3 greater than 9. Since -3 greater than 9 is a false statement, this means that all values in the interval we’re testing are not solutions to inequality, so we don’t shade the interval. Next, we test a value from the “greater than 3” interval, such as 4. If we plug a 4 back in for both x’s in the original inequality, we have 4 squared – 3 greater than 9 – 4, which simplifies to 16 – 3 greater than 5, or 13 greater than 5. Since 13 greater than 5 is a true statement, this means that all values in the interval we’re testing are solutions to inequality, so we shade the interval. Finally, we write the answer that’s shown on our graph in set notation. The set of all x’s such that x is less than -4 or x is greater than 3.
[3.MD.1-3.0] Time to Nearest Minute - Common Core Standard
By Front Row
Discover more Common Core Math at https://www.frontrowed.comMeasure time intervals in minutesFront Row is a free, adaptive, Common Core aligned math program for teachers and students in kindergarten through eighth grade. Front Row allows students to practice math at their own pace - learning advanced concepts when they 're ready and receiving remediation when they struggle. Front Row provides teachers with access to a detailed data dashboard and weekly email reports that show which standards are causing students difficulty, what small groups can be formed for interventions, and how their students are progressing in math.Discover more Common Core Math at https://www.frontrowed.com
Motion - Introduction | Don't Memorise

By Lumos Learning
In our earlier grades, we have studied motion and its types. Let’s have a quick review! Let’s start with motion. In simple words, if a body is moving, it’s described as motion!
[4.MD.2-2.0] Word Problems Involving Measurement - Common Core Standard

By Freckle Education
Discover more Common Core Math at https://www.frontrowed.comUse the four operations to solve word problems involving distances, intervals of time, liquid volumes, masses of objects, and money, and involving simple fractions or decimalsFront Row is a free, adaptive, Common Core aligned math program for teachers and students in kindergarten through eighth grade. Front Row allows students to practice math at their own pace - learning advanced concepts when they 're ready and receiving remediation when they struggle. Front Row provides teachers with access to a detailed data dashboard and weekly email reports that show which standards are causing students difficulty, what small groups can be formed for interventions, and how their students are progressing in math.Discover more Common Core Math at https://www.frontrowed.com
1.3 How to determine the domain and range of three graphs - domain and range

By Mr. McLogan's Math Channel
http://www.freemathvideos.com n this math tutorial I describe how to find the domain of a function by determining when the bottom of a rational function is zero and when the root is negative. I also might look at the graph and determine the intervals for the domain of the function. For a rational expression we set the bottom of the rational expression to zero and solve for x. For a function with an even root we set the radicand greater than or equal to zero and solve for x. I show how to solve math problems online during live instruction in class. This is my way of providing free tutoring for the students in my class and for students anywhere in the world. Every video is a short clip that shows exaclty how to solve math problems step by step. The problems are done in real time and in front of a regular classroom. These videos are intended to help you learn how to solve math problems review how to solve a math problems study for a test or finish your homework.I post all of my videos
Functions and Graphs

By The Organic Chemistry Tutor
This precalculus provides a basic introduction into functions and graphs. It contains plenty of examples and multiple choice practice problems.
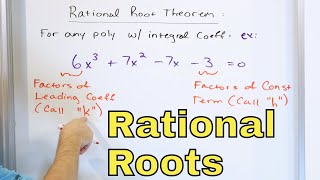
20 - The Rational Root Theorem, Part 1 (Rational Roots of Polynomials)
By Math and Science
Quality Math And Science Videos that feature step-by-step example problems!
10th Grade Modeling with Systems of Equations

By
10th grade math lesson on modeling with systems of equations. The lesson involved high school modeling standard A.CED.A.2 from the MA Curriculum Frameworks for Mathematics, which specifies creating equations in two or more variables.
14 - The Discriminant of a Quadratic, Part 1 (Quadratic Formula Problems)

By Math and Science
Quality Math And Science Videos that feature step-by-step example problems!

How To Graph Trigonometric Functions

By The Organic Chemistry Tutor
This trigonometry video tutorial explains how to graph sine and cosine functions using transformations, horizontal shifts / phase shifts, vertical shifts, amplitude, and the period of the sinusoidal function. This video contains many examples and practice problems on graphing trigonometric functions for you to master this topic.