Lumos Video Store
This page provides a list of educational videos related to Graphing by Plotting. You can also use this page to find sample questions, apps, worksheets, lessons , infographics and presentations related to Graphing by Plotting.
graphs and data line plot -"dot plots"

By Joann's School
Learn how to read and create a Line Plot (Dot Plot)
Understanding logarithms as inverse exponentials

By Khan Academy
Given a few points on the graph of an exponential function, Sal plots the corresponding points on the graph of the corresponding logarithmic function.

Khan Academy: Plotting (x y) Relationships
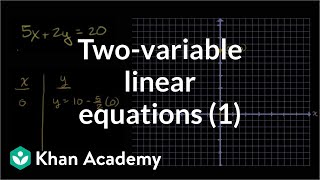
By Khan Academy
This video from Khan Academy demonstrates how to plot (x y) relationships. Shows how to create a graph from the linear equation: 5x + 2y = 20
Box and Whisker Plots : Skewness and Outliers. : ExamSolutions

By ExamSolutions
Youtube Presents Box and Whisker Plots : Skewness and Outliers. : ExamSolutions an educational video resources on statistics.
[4.MD.4-1.0] Fractional Line Plots - Common Core Standard
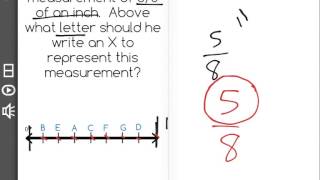
By Freckle education
Make a line plot to display a data set of measurements in fractions of a unit (1/2, 1/4, 1/8)
Line plots and stem-and-leaf plots
By MathPlanetVideos
Construct a stem-and-leaf plot out of the following data: 6, 6,7,8,9,13,16,19,21,25,26
Inverse Functions | MathHelp.com
By MathHelp.com
In this example, we’re given a relation in the form of a chart, and we’re asked to find the inverse of the relation, then graph the relation and its inverse. To find the inverse of a relation, we simply switch the x and y values in each point. In other words, the point (1, -4) becomes (-4, 1), the point (2, 0) becomes (0, 2), the point (3, 1) becomes (1, 3), and the point (6, -1) becomes (-1, 6). Next, we’re asked to graph the relation and its inverse, so let’s first graph the relation. Notice that the relation contains the points (1, -4,), (2, 0), (3, 1), and (6, -1). And the inverse of the relation contains the points (-4, 1), (0, 2), (1, 3), and (-1, 6). Finally, it’s important to understand the following relationship between the graph of a relation and its inverse. If we draw a diagonal line through the coordinate system, which is the line that has the equation y = x, notice that the relation and its inverse are mirror images of each other in this line. In other words, the inverse of a relation is the reflection of the original relation in the line y = x.
Plot and Subplots: Creative Fiction Writing

By Cy Porter
Find and map out the plot and all the subplots in your story. Work on them separately to improve your story. It's better to look at each subplot separated from the rest of the story. Use subplot to make three dimensional characters.
Ex: Matching Correlation Coefficients to Scatter Plots

By Mathispower4u
Ex: Matching Correlation Coefficients to Scatter Plots

Stem and Leaf Plots in Statistics

By mathtutordvd
In this lesson, you'll learn what a stem-and-leaf plot is in statistics is and why it is important.
Stem and Leaf Plots and Histograms: An Application (Algebra I)

By CK-12 Foundation
This video demonstrates a sample use of stem-and-leaf plots and histograms.
What are Quartiles and Boxplots

By StraighterLine
YouTube presents What are Quartiles and Boxplots, an educational video resource on statistics and probability.


[2.MD.10-1.0] Picture and Bar Graphs - Common Core Standard

By Freckle education
Draw a picture graph and bar graph (with single-unit scale) to represent a data set with up to four categories.
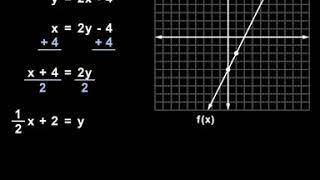
Graphs of linear equations | Linear equations and functions | 8th grade

By Khan Academy
A video that goes over graphing linear equations on the coordinate plane. The first part of the video starts with an equation with two variables, x and y. The instructor finds sample points and then plots them. Then, he moves on to some more complicated and conceptual problems.
Interpreting Line plots
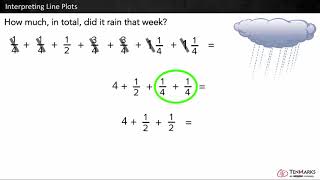
By Tenmarks Amazon
Students learn to interpret line plots by using the given data to answer questions involving fractions and whole numbers.