Get Full Access to SBAC Grade 11 Mathematics Master Course
Currently, you have limited access to SBAC Grade 11 Mathematics Master Course . The Full Program includes,
Buy Practice Resources
 Online Program
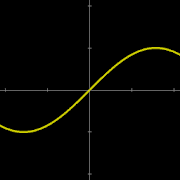
Suppose a truck has GPS speed indicator equipment installed. The graph below shows the speed of the truck during an 8 hour trip. The entire trip is on a road that has a 40 mile per hour speed limit. What does the graph indicate in the interval from 1 hour to 5 hours into the trip.


Give Your List Name
Word List
