Lumos Video Store
This page provides a list of educational videos related to Frequency and Histograms. You can also use this page to find sample questions, apps, worksheets, lessons , infographics and presentations related to Frequency and Histograms.

Absolute Value | MathHelp.com
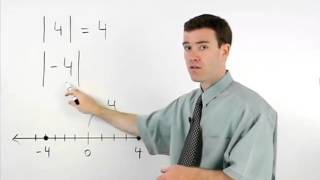
By MathHelp.com
This lesson covers histograms. Students learn that a histogram is a type of bar graph that shows the frequency of data in various intervals (such as the number of residents in a given neighborhood that are age 21-30, age 31-40, and so on). Note that the difference between a histogram and a bar graph is that in a histogram, the data is organized into intervals. Students are then asked to create histograms using given data, and answer questions based on given histograms.
Probabilty Models and Two Way frequency tables
By Mr. Beamer's Math Videos
Using two way frequency tables to find probabilities
Mean and Expected Value of Discrete Random Variables
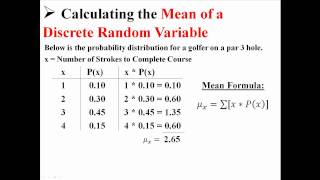
By statslectures
This video summarizes for us in less than two minutes how to find the expected value for a discrete random variable. In order to apply this to empirical data, form a histogram from your data and use that to determine relative frequencies.

Introduction to Frequency Tables

By Bryan Corcoran
A brief introduction to the use of Frequency Tables. Definitions of statistics, data, and frequency table are discussed.
Standard Deviation from frequency tables : ExamSolutions
By ExamSolutions
Youtube Presents Standard Deviation from frequency tables : ExamSolutions an educational video resources on english language arts.

