Array
Lumos Video Store
This page provides a list of educational videos related to Using Bar Graphs to Display Data. You can also use this page to find sample questions, apps, worksheets, lessons , infographics and presentations related to Using Bar Graphs to Display Data.
Bar Graphs- Pre Algebra Help
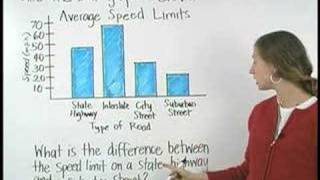
By yourteachermathhelp
Students learn that a bar graph is a visual way to display and compare numerical data (such as the population of different southern states). The bars of a bar graph are drawn in relation to a horizontal axis and a vertical axis and a bar graph can have either vertical or horizontal bars. Students are then asked to create bar graphs using given data and answer questions based on given bar graphs.
Understanding Measurement Data Displayed in Line Plots: 2.MD.9

By Tenmarks Amazon
Students learn how to interpret measurement data displayed in line plots.
Introduction to line plots | Measurement and data | Early Math | Khan Academy
By KhanAcademy
Explanation about line plots