Lumos Video Store
This page provides a list of educational videos related to The Mean of the Data. You can also use this page to find sample questions, apps, worksheets, lessons , infographics and presentations related to The Mean of the Data.
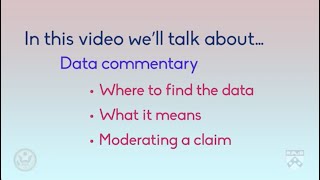
Language Focus: Data Commentary
By
In this video, we'll look at describing data in tables and figures. This process is how a journalist can tell people what the numbers and figures in an article mean. We call this data commentary. We'll look at three things: where to find the data, what it means, and moderating a claim.
Calculating the mean from data displays
By Khan Academy
This is a fantastic intro to the basics of statistics. Our focus here is to help you understand the core concepts of arithmetic mean, median, and mode.
Inferring population mean from sample mean | Probability and Statistics | Khan Academy

By Khan Academy
Much of statistics is based upon using data from a random sample that is representative of the population at large. From that sample mean, we can infer things about the greater population mean. We'll explain.
Statistics intro: Mean, median, and mode | Data and statistics | 6th grade | Khan Academy
By Khan Academy
This is a fantastic intro to the basics of statistics. Our focus here is to help you understand the core concepts of arithmetic mean, median, and mode.

Range, variance and standard deviation as measures of dispersion
By Khan Academy
This video goes over the main ways we measure dispersion of data, then shows those vlaues for two different data sets. Remember that simply comparing the means or medians of two data sets is not sufficient to fully compare the data. Understanding how data is arranged about the "center" of the data is also critical in understand and comparing the sets
By Khan Academy
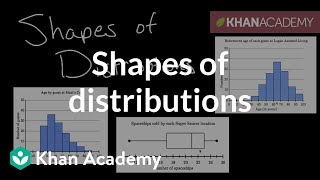
Some distributions are symmetrical, with data evenly distributed about the mean. Other distributions are skewed, with data tending to the left or right of the mean. We sometimes say that skewed distributions have tails.,1211
Effects of shifting, adding, and removing a data point

By Khan Academy
Sal thinks through the effects of modifying a value in a data set. What will happen to the mean and median?
Effects of shifting, adding, and removing a data point

By Khan Academy
Sal thinks through the effects of removing a low outlier from a data set. What will happen to the mean and median?

6.SP.5.a - Report the Number of Observations in a Data Set

By MathwithMrAlmeida
In this video, Mr. Almeida explains how to report the number of observations, or the n, in a data set. This is very important, as it is the foundation for being able to find statistical measures such as mean and mean absolute deviation. This address Common Core Standards for Mathematics indicator 6.SP.5.a.
Finding One Variable Statistics With a Graphing Calculator

By YouTube (Firm)
This quick YouTube video from high school statistics teacher Roger W. Davis explains how to find one variable statistics using the TI-84 graphing calculator. The demonstration goes through three steps: entering the data, finding one variable statistics using the STAT menu, and interpreting the results. The data created includes mean, sum, median and more. Flash player is required to view this video, and the running time for the clip is 3:12.


Standard error of the mean | Inferential statistics | Probability and Statistics | Khan Academy
By Khan Academy
This video lecture series on Introduction to Statistics includes Average, Sample vs Population, Variance, Standard Deviation, Random Variables, Probability density functions, Binomial distribution, Poisson Process, Law of Large numbers and Normal Distribution.
Difference of sample means distribution | Probability and Statistics | Khan Academy

By Khan Academy
This video lecture series on Introduction to Statistics includes Average, Sample vs Population, Variance, Standard Deviation, Random Variables, Probability density functions, Binomial distribution, Poisson Process, Law of Large numbers and Normal Distribution.


Difference of sample means distribution | Probability and Statistics | Khan Academy
By Khan Academy
This video lecture series on Introduction to Statistics includes Average, Sample vs Population, Variance, Standard Deviation, Random Variables, Probability density functions, Binomial distribution, Poisson Process, Law of Large numbers and Normal Distribution......