The PARCC Math score report provides a wealth of information about a student’s progress in meeting grade level expectations. It is designed to be a snapshot of this development looking only at their performance on the assessment. The report also provides a deeper level of information that can be used to understand better where students are doing well and where they need additional support that can help teachers and parents support students. This data is broken up into two key areas: Level Performance and Additional Information.
Level Performance
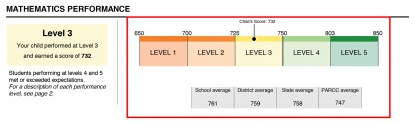
The first section of the score report, the Level, includes the student’s overall score and what level their score can be found. The overall score is derived from a total possible of 850 points. It combines the scores from all the various portions of the test. That score is then placed in a level area, either 1, 2, 3, 4, 5. The student’s score is graphed in a bar graph to the right of the overall score; a score in Level 1 indicates the largest need for improvement and a score in Level 5 shows the greatest success. Score leveling also indicates how the student is performing compared to other students who have taken the same test. The key on the second page of the score report indicates the different level descriptors.
- Level 1 – Did not meet expectation
- Level 2 – Partially met expectations
- Level 3 – Approached expectations
- Level 4 – Met expectations
- Level 5 – Exceeds expectations
The Level area also provides a glimpse of how students are performing compared to other in the school, the district, the state, and in the PARCC consortium.
Additional Information
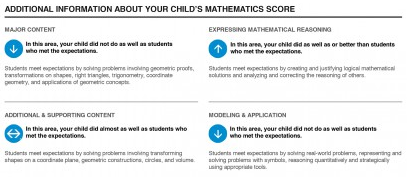
This section includes information on how the student is performing on specific mathematics skills and subtopics including, major content, additional and supporting content, expressing mathematical reasoning, and modeling and data application. Each area includes a description of the skills the student needs to exhibit to master the individual subtopics. The report also shows a visual representation of performance in the different sub-topics of a literary text, informational text, and vocabulary text. The down arrow indicates the student performed below level, the arrows pointing outwards indicate the student is nearly meeting expectations, and the up arrow indicates they have met or exceeded expectations.
PARCC continually assess and update the appropriateness of their system to ensure it is meeting the needs of students. As PARCC continues to evaluate their assessment system and scores, student performance levels may adjust some in the future.