- Practice FSA test online at Lumos-Learning
- Individual Score Reports
- FSA Performance Level
- Scale Score
- Previous Performance
- Performance Compared
- Reporting Categories
- FSA ELA Reporting
- FSA Math Reporting
- How to Use the FSA Report Card
The Florida Statewide Assessment (FSA) measures student achievement of Florida’s statewide learning standards in English Language Arts and Mathematics. These assessments are administered K-12 and help educational leaders in Florida determine whether or not Florida schools are effective in helping students learn the knowledge and skills they’ll find necessary in their future careers or their continued college-level coursework.
Practice FSA test online at Lumos-Learning
Just like with many state-level assessments, Florida uses the FSA test to not only to drive instruction and support student learning; assessment scores & performance levels from the FSA also determine student, school, and district accountability.
Students take an FSA exam over the English Language Arts standards in grades 3-10. The reading section of the assessment is administered in Grades 3-10 while the writing section is administered in Grades 4-10.
Mathematics is assessed in Grades 3-8 with the FSA.
Individual Score Reports
Students who take an FSA in either ELA or Mathematics will receive a four-page color Individual Score Report. In addition to giving general information about the FSA program, the Individual Score Report shows a student’s scale score, performance level, previous performance, and reporting category scores. The report also shows comparison information of the student’s performance with other students who took the same test in the same school, district, and across the state. Finally, the report includes a list of recommended resources for parents and students to go deeper into the FSA program.
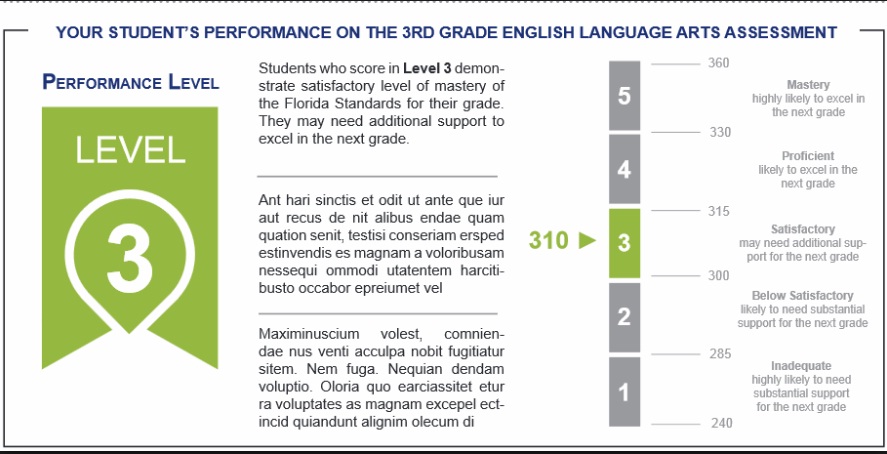
FSA Performance Level
The FSA results are divided into five Performance Levels, Levels 1-5. The levels are broken down as follows:
| Level 5 | Mastery, which means the student is highly likely to succeed in the next grade level |
| Level 4 | Proficient, which means the student is likely to succeed in the next grade level |
| Level 3 | Satisfactory, which means the student may need additional support in the next grade |
| Level 2 | Below Satisfactory, which means the student is likely to need substantial support in the next grade |
| Level 1 | Inadequate – which means the student is highly likely to need substantial support in the next grade |
In the above example, the student has scored 310 and is at level 3 performance.
Scale Score
The performance levels are placed on a graph and a student’s scale score determines which performance level the student falls into. If the FSA a student is taking requires a passing score as a part of a graduation requirement, the report will also indicate whether or not the student met the graduation requirement. There is also a passing score indicator for the specific FSA being taken.
Previous Performance
This section is especially helpful for students who have been taking FSA assessments for multiple years because they can track their progress over time. This section displays a chart with a student’s most recent and previous performance on FSA ELA or Mathematics assessments dating back to spring 2015.
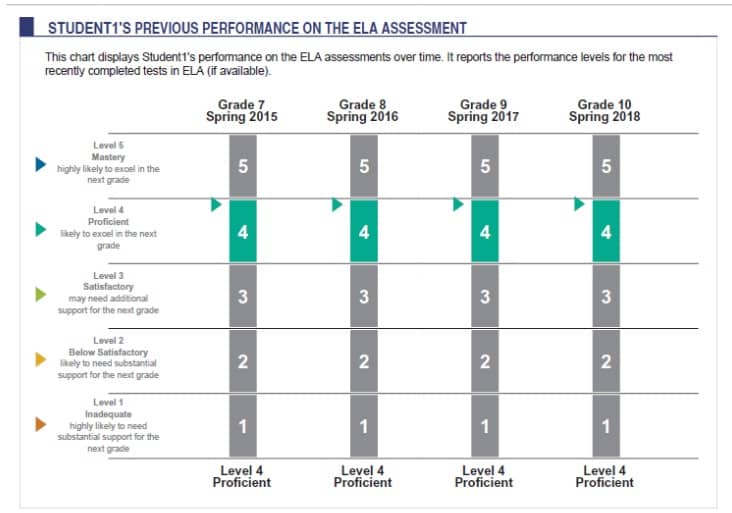
In the above example, the student has consistently performed and maintained level 4.
Performance Compared
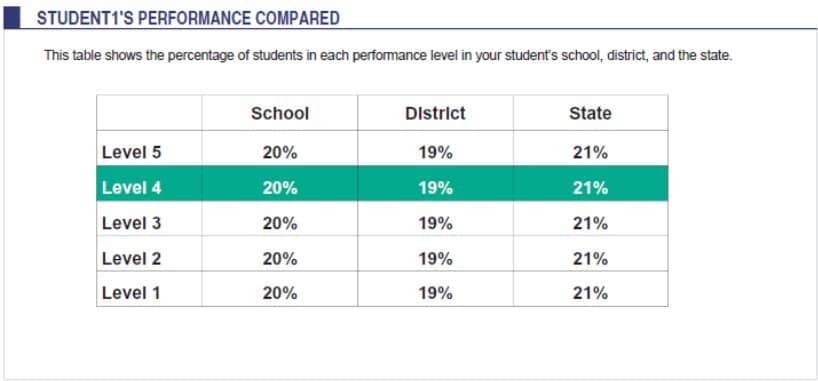
This section includes a table that lists the percentage of students in each of the performance levels within the student’s school, district, and state.
Reporting Categories
This section lists the reporting categories assessed for either ELA or Mathematics FSA tests. The Points Earned column shows the actual number of points a student earned while the Points Possible column indicates the total number of points possible for each reporting category. This breakdown can be really helpful for parents and teachers in identifying where students are struggling.
FSA ELA Reporting
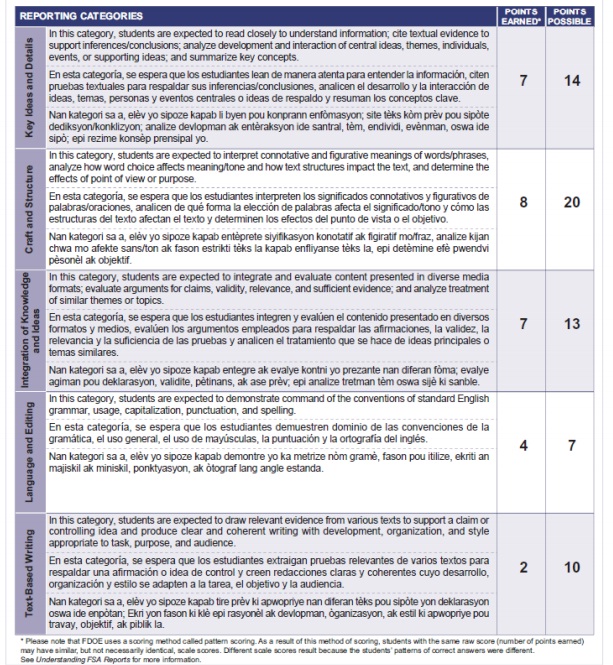
In the above example, it can be seen that the student performance, especially in areas of Language and editing as well as text-based writing needs considerable improvement and focus.
FSA Math Reporting
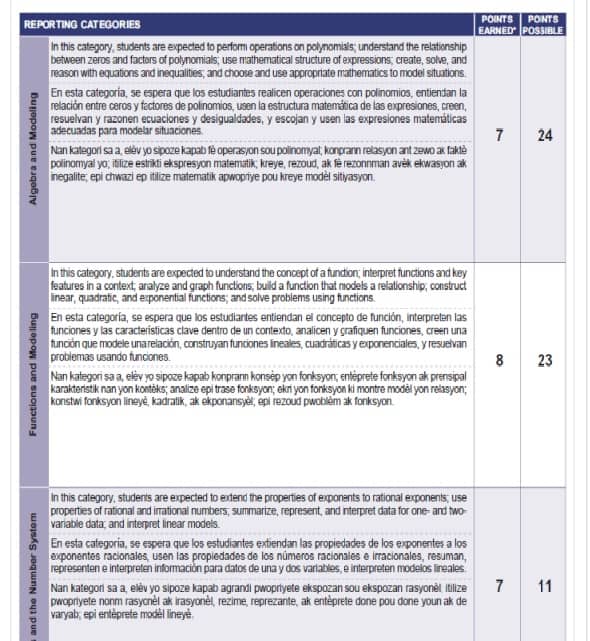
A similar report for Math is also available. The above example is for a student performance in high School Math.
How to Use the FSA Report Card
Teachers can use the data collected by the FSA assessments to identify learning areas to focus on as they seek to improve the instruction occurring in their classrooms. Parents can help support their students by getting with their students’ teachers and finding out how they can enhance their students’ learning both at home and at school.

Hello,
What percentage of Third graders get a perfect score in the math test? My Grandson did and I am curious.
Thank you,
John Mills
Pingback: Reading SBAC Test Scores & Performing Levels | Lumos Learning