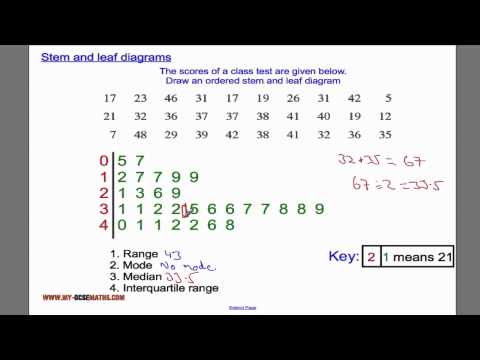
Analyzing and Comparing Statistical Data
Pinned By - Liz Dayton
DESCRIPTION:
Grade(s): 7
Subject(s): Math
Standard(s): 7.SP.B.3
OVERVIEW:
Analyzing and Comparing Statistical Data is a educational Infographics - By Liz Dayton.It helps students in grades 7 practice the following standards 7.SP.B.3.
This page not only allows students and teachers to get information about the book but also find engaging Sample Questions, Videos, Pins, Worksheets, Apps related to the following topics.
1. 7.SP.B.3 : Informally assess the degree of visual overlap of two numerical data distributions with similar variabilities, measuring the difference between the centers by expressing it as a multiple of a measure of variability. For example, the mean height of players on the basketball team is 10 cm greater than the mean height of players on the soccer team, about twice the variability (mean absolute deviation) on either team; on a dot plot, the separation between the two distributions of heights is noticeable..
RELATED PINS:


