assignment_returnWorksheet:
Graphs
Standard(s): 3.MD.B.3

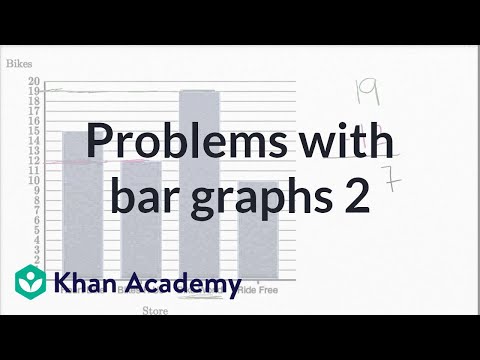
Use the graph below to answer the following question.

Which two sports had the same number of students?
dance and cheer
basketball and cheer
basketball and soccer
dance and soccer
Standard: 3.MD.B.3
Domain: Measurement & Data
Theme: Represent and interpret data
Description: Draw a scaled picture graph and a scaled bar graph to represent a data set with several categories. Solve one- and two-step "how many more" and "how many less" problems using information presented in scaled bar graphs. For example, draw a bar graph in which each square in the bar graph might represent 5 pets.
Use the graph below to answer the following question.
Which sport is the least popular?
basketball
soccer
cheer
dance
Standard: 3.MD.B.3
Domain: Measurement & Data
Theme: Represent and interpret data
Description: Draw a scaled picture graph and a scaled bar graph to represent a data set with several categories. Solve one- and two-step "how many more" and "how many less" problems using information presented in scaled bar graphs. For example, draw a bar graph in which each square in the bar graph might represent 5 pets.

The line plot shows the number of days it rained in New Jersey from January through May. What is the title of the above graph?
Line plot
Rainy Days in New Jersey
Months
2 days
Standard: 3.MD.B.3
Domain: Measurement & Data
Theme: Represent and interpret data
Description: Draw a scaled picture graph and a scaled bar graph to represent a data set with several categories. Solve one- and two-step "how many more" and "how many less" problems using information presented in scaled bar graphs. For example, draw a bar graph in which each square in the bar graph might represent 5 pets.

Which of the following statements about the above graph is true?
The graph shows New Jersey's monthly rainy days from January through May.
The graph shows rainfall amounts.
The graph shows the average temperature during the 5 month period.
The graph shows New Jersey's total number of rainy days for the year.
Standard: 3.MD.B.3
Domain: Measurement & Data
Theme: Represent and interpret data
Description: Draw a scaled picture graph and a scaled bar graph to represent a data set with several categories. Solve one- and two-step "how many more" and "how many less" problems using information presented in scaled bar graphs. For example, draw a bar graph in which each square in the bar graph might represent 5 pets.

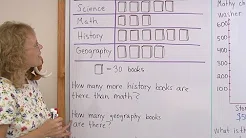
50 more kids
10 more kids
1 more kid
15 more kids