assignment_returnWorksheet:
Representing And Interpreting Data
Standard(s): 5.MD.B.2

A 5th grade science class went on a nature walk. The students each selected one leaf and weighed it when they got back to the room. They recorded their data on this line plot.

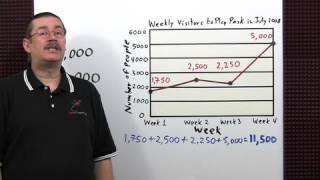
What is the total weight of all the leaves?
9 g
9/10 g
90 g
9/100 g
Standard: 5.MD.B.2
Domain: Measurement & Data
Theme: Represent and interpret data
Description: Make a line plot to display a data set of measurements in fractions of a unit (1/2, 1/4, 1/8). Use operations on fractions for this grade to solve problems involving information presented in line plots. For example, given different measurements of liquid in identical beakers, find the amount of liquid each beaker would contain if the total amount in all the beakers were redistributed equally.
A 5th grade science class went on a nature walk. The students each selected one leaf and weighed it when they got back to the room. They recorded their data on this line plot.
According to this line plot, how many leaves weigh less than the most frequent weight?
9
5
0
1
Standard: 5.MD.B.2
Domain: Measurement & Data
Theme: Represent and interpret data
Description: Make a line plot to display a data set of measurements in fractions of a unit (1/2, 1/4, 1/8). Use operations on fractions for this grade to solve problems involving information presented in line plots. For example, given different measurements of liquid in identical beakers, find the amount of liquid each beaker would contain if the total amount in all the beakers were redistributed equally.
A 5th grade science class went on a nature walk. The students each selected one leaf and weighed it when they got back to the room. They recorded their data on this line plot.
According to this line plot, what is the mode for this set of data?
1
15
5/10
4/10
Standard: 5.MD.B.2
Domain: Measurement & Data
Theme: Represent and interpret data
Description: Make a line plot to display a data set of measurements in fractions of a unit (1/2, 1/4, 1/8). Use operations on fractions for this grade to solve problems involving information presented in line plots. For example, given different measurements of liquid in identical beakers, find the amount of liquid each beaker would contain if the total amount in all the beakers were redistributed equally.
A 5th grade science class went on a nature walk. The students each selected one leaf and weighed it when they got back to the room. They recorded their data on this line plot.
According to this line plot, how many leaves weigh more than 7/10 g?
1
5
9
0
Standard: 5.MD.B.2
Domain: Measurement & Data
Theme: Represent and interpret data
Description: Make a line plot to display a data set of measurements in fractions of a unit (1/2, 1/4, 1/8). Use operations on fractions for this grade to solve problems involving information presented in line plots. For example, given different measurements of liquid in identical beakers, find the amount of liquid each beaker would contain if the total amount in all the beakers were redistributed equally.
A 5th grade science class went on a nature walk. The students each selected one leaf and weighed it when they got back to the room. They recorded their data on this line plot.
According to this line plot, how many leaves were measured in all?
15
4/10
6/10
11