Lumos Video Store
This page provides a list of educational videos related to Using a Graphing Calculator. You can also use this page to find sample questions, apps, worksheets, lessons , infographics and presentations related to Using a Graphing Calculator.
Velocity Time Graphs, Acceleration & Position Time Graphs - Physics

By The Organic Chemistry Tutor
This physics video tutorial provides a basic introduction into motion graphs such as position time graphs, velocity time graphs, and acceleration time graphs. It explains how to use area and slope to calculate the velocity, acceleration, displacement, and whether if the particle is speeding up or slowing down. It also explains how to determine if the velocity is increasing or if the acceleration is positive.
Creating Exponential Functions Part 1

By TeacherTube Math
WEBSITE: http://www.teachertube.com The basic exponential function y abquotx is applied to situations in compounding interest radioactive decay half life and population growth. The graphing calculator is used to evaluate the functions for different input values. The Tableset feature in the calculator is used.
Creating Exponential Functions Part 1
By TeacherTube Math
WEBSITE: http://www.teachertube.com The basic exponential function y abquotx is applied to situations in compounding interest radioactive decay half life and population growth. The graphing calculator is used to evaluate the functions for different input values. The Tableset feature in the calculator is used.
Quadratic Model: Enclosing a field with a fence

By SuperMathPrincess
How to create a quadratic function that represents the area of a rectangular field as a function of the width of the field, given a specific amount of fencing to enclose the field. Also includes how to find the maximum area and the dimensions of the field needed to obtain that maximum area, both by hand and by using a TI-83 plus graphing calculator.
Finding One Variable Statistics With a Graphing Calculator

By YouTube (Firm)
This quick YouTube video from high school statistics teacher Roger W. Davis explains how to find one variable statistics using the TI-84 graphing calculator. The demonstration goes through three steps: entering the data, finding one variable statistics using the STAT menu, and interpreting the results. The data created includes mean, sum, median and more. Flash player is required to view this video, and the running time for the clip is 3:12.

GMAS 2020-21 Blueprint and Best Practices | 10 Min. webinar organized by EdShorts

By Lumos Learning
This Free 10 Min power-packed webinar organized by EdShorts on Jan 7th provides all the information available about 2021 Georgia Milestones Assessments - such as changes in blueprints, policy changes, testing windows, and other details. Join the EdShorts Facebook community today: https://www.facebook.com/groups/60370... for more bite-sized power-packed webinars every week! For FAQs on GMAS 2021, visit, https://www.lumoslearning.com/llwp/ab... Get free access to Math and ELA realistic GMAS test practice and sample questions for all grades at: https://www.lumoslearning.com/llwp/re...
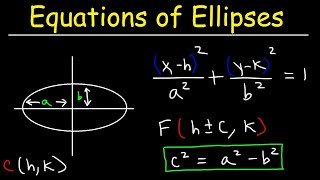
Writing Equations of Ellipses In Standard Form and Graphing Ellipses - Conic Sections
By The Organic Chemistry Tutor
This algebra video tutorial explains how to write the equation of an ellipse in standard form as well as how to graph the ellipse when in standard form. It explains how to find the coordinates of the foci, vertices, and co-vertices. This video contains plenty of examples and practice problems.
Finding The Focus and Directrix of a Parabola - Conic Sections

By The Organic Chemistry Tutor
This video tutorial provides a basic introduction into parabolas and conic sections. It explains how to graph parabolas in standard form and how to graph parabolas with the focus and directrix. The vertex of the parabola can be identified by analyzing the equation in standard form.

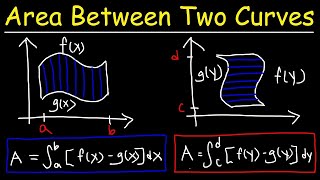
Area Between Two Curves
By The Organic Chemistry Tutor
This calculus video tutorial provides a basic introduction in finding the area between two curves with respect to y and with respect to x. It explains how to set up the definite integral to calculate the area of the shaded region bounded by the two curves. In order to find the points of intersection, you need to set the two curves equal to each other and solve for x or y. You need to be familiar with some basic integration techniques for this lesson. This video contains plenty of examples and practice problems.
ALL OF GRADE 9 MATH IN 60 MINUTES!!! (exam review part 2)

By Lumos Learning
Here is a great exam review video reviewing all of the main concepts you would have learned in the MPM1D grade 9 academic math course. The video is divided in to 3 parts. This is part 2: Linear Relations. In this video you will review everything there is to know about y=mx+b, scatterplots, and distance time graphs.
What is a Natural Log Ln(x)? - Part 1 (Logarithm w/ Base e - Euler's number)

By Math and Science
Quality Math And Science Videos that feature step-by-step example problems!
Hooke's Law and Elastic Potential Energy

By The Organic Chemistry Tutor
This video provides a basic introduction into Hooke's law. It explains how to calculate the elastic potential energy and how to determine the amount of work required to stretch a spring.
MAP 2020-21 Blueprint and Best Practices | 10 Min. webinar organized by EdShorts

By Lumos Learning
This Free 10 Min power-packed webinar organized by EdShorts on Jan 28th provides all the information available about 2021 LEAP Assessments - such as testing guidelines, blueprint changes, testing windows, and more! Join the EdShorts Facebook community today: https://www.facebook.com/groups/60370... for more bite-sized power-packed webinars every week!
11th Grade Mathematics

By
11th grade math lesson in which students interpret linear models and the correlation coefficient, and make predictions based on data.
01 - Direct Variation and Proportion in Algebra - Part 1 (Constant of Variation & More)

By Math and Science
Quality Math And Science Videos that feature step-by-step example problems!
15 - What is a Logarithm (Log x) Function? (Calculate Logs, Applications, Log Bases)

By Math and Science
Quality Math And Science Videos that feature step-by-step example problems!
14 - The Discriminant of a Quadratic, Part 1 (Quadratic Formula Problems)

By Math and Science
Quality Math And Science Videos that feature step-by-step example problems!
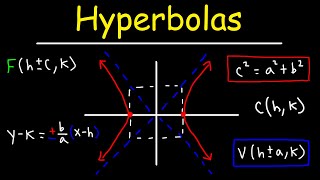
Hyperbolas - Conic Sections
By The Organic Chemistry Tutor
This conic sections video tutorial provides a basic introduction into hyperbolas. It explains how to graph hyperbolas and how to find the coordinates of the center, vertices, and foci. In addition, it explains how to write the equations of the asymptotes.