Lumos Video Store
This page provides a list of educational videos related to Tables and Graphs. You can also use this page to find sample questions, apps, worksheets, lessons , infographics and presentations related to Tables and Graphs.
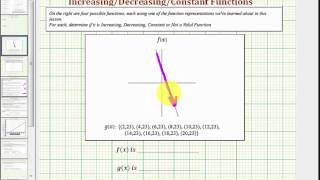
Ex: Determine if a Function is Incr, Decr, or Constant from Graph, Table, and Ordered Pairs
By Mathispower4u
Ex: Determine if a Function is Incr, Decr, or Constant from Graph, Table, and Ordered Pairs
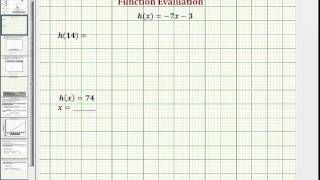
Ex: Find Function Output and Input Using a Graph, Table, Ordered Pairs, and Function Rule
By Mathispower4u
Ex: Find Function Output and Input Using a Graph, Table, Ordered Pairs, and Function Rule
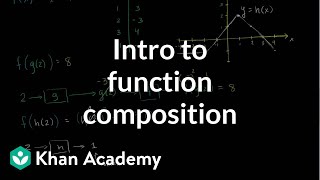
Evaluate composite functions from graphs and tables
By Khan Academy
Sal explains what it means to compose two functions. He gives examples for finding the values of composite functions given the equations, the graphs, or tables of values of the two composed functions.
Evaluate composite functions from graphs and tables
By Khan Academy
Sal explains what it means to compose two functions. He gives examples for finding the values of composite functions given the equations, the graphs, or tables of values of the two composed functions.
Evaluate composite functions from graphs and tables
By Khan Academy
Sal explains what it means to compose two functions. He gives examples for finding the values of composite functions given the equations, the graphs, or tables of values of the two composed functions.
Comparing linear functions
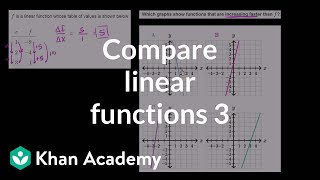
By Khan Academy
Sal is given a table of values of a linear function and four linear graphs, and is asked to determine which graph increases faster than the function represented in the table.
Comparing linear functions
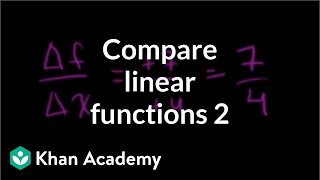
By Khan Academy
Sal is given a table of values of a linear function and four linear graphs, and is asked to determine which graph has the same rate of change as the function represented in the table.
Comparing features of functions

By Khan Academy
Given several functions represented in different forms (as a formula, as a graph, and as a table of values), Sal finds the one with that has no x-intercepts.
Comparing linear functions
By Khan Academy
Sal is given a table of values of a linear function and four linear graphs, and is asked to determine which graph has the same rate of change as the function represented in the table.
Comparing linear functions
By Khan Academy
Sal is given a table of values of a linear function and four linear graphs, and is asked to determine which graph increases faster than the function represented in the table.
Comparing features of functions

By Khan Academy
Given several quadratic functions represented in different forms (as a formula, as a graph, and as a table of values), Sal finds the one with the lowest maximum value.
How to Make a Frequency Table

By TheMathClips
This short video demonstrates how to organize data into a frequency table, making it easier to interpret or make into a graph.
How to Make a Frequency Table
By TheMathClips
This short video demonstrates how to organize data into a frequency table, making it easier to interpret or make into a graph.
Slope and Proportional Relationships

By ElaineandTomDorlis
13 min video shows how to graph from a table and/or using an equation. Also discussed various types of slopes.
How to Make a Frequency Table
By TheMathClips
This short video demonstrates how to organize data into a frequency table, making it easier to interpret or make into a graph.
Graphing Quadratic Equations
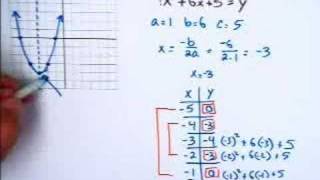
By Marc Whitaker
Instructor uses a white board to model graphing quadratic equations. Examples show using quadratic equations in standard form to determine the line of symmetry, create a table of values, and graph the quadratic equation by using these values.
Recognizing functions from graphs

By Khan Academy
Sal checks whether a given set of points can represent a function. For the set to represent a function, each domain element must have one corresponding range element at most.
Exponential growth functions | Exponential and logarithmic functions | Algebra II | Khan Academy
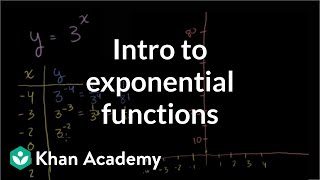
By Khan Academy
Watch this introduction to exponential growth functions, including the form of an exponential function, an exponential input output table, the graph of an exponential function, and scenarios modeled by exponential growth.
Quickly Graph Absolute Value Functions
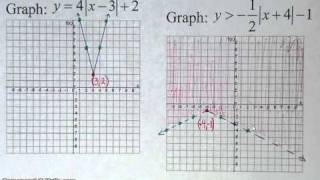
By WOWmath.org
YouTube presents Quickly Graph Absolute Value Functions, an educational video resource on math.