Lumos Video Store
This page provides a list of educational videos related to Scale Drawings and Maps. You can also use this page to find sample questions, apps, worksheets, lessons , infographics and presentations related to Scale Drawings and Maps.
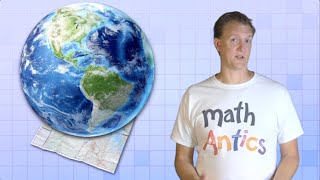
What is a Map? Crash Course Geography #2

By Math and Science
Quality Math And Science Videos that feature step-by-step example problems!
More solving problems with bar graphs | Fractions | 3rd grade

By Khan Academy
Interpret bar graphs to answer questions about a context.
Algebra - Equations on a Balance Scale (6-EE-A-2, 6-EE-B-5, 6-EE-B-6)
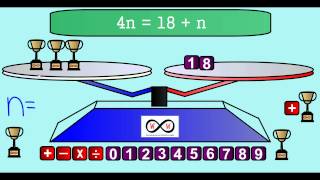
By Worksheets and Walkthroughs
This video walkthrough lesson guides you through the process of using a balance scale and manipulatives as visual representations of an equation with a variable representing an unknown value. The solution is also represented as a tape diagram/model drawing. A story problem is also given to provide a meaningful context. (6-EE-A-2, 6-EE-B-5, 6-EE-B-6)
Grade 7 Math - Scale Models

By Lumos Learning
Using the Lumos Study Programs, parents and educators can reinforce the classroom learning experience for children and help them succeed at school and on the standardized tests. Lumos books, dvd, eLearning and tutoring are used by leading schools, libraries and thousands of parents to supplement classroom learning and improve student achievement in the standardized tests.
15 - What is a Logarithm (Log x) Function? (Calculate Logs, Applications, Log Bases)

By Math and Science
Quality Math And Science Videos that feature step-by-step example problems!
Grade 3 Math - Graphs

By Lumos Learning
Using the Lumos Study Programs, parents and educators can reinforce the classroom learning experience for children and help them succeed at school and on the standardized tests. Lumos books, dvd, eLearning and tutoring are used by leading schools, libraries and thousands of parents to supplement classroom learning and improve student achievement in the standardized tests.
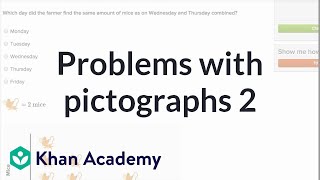
Reading pictographs
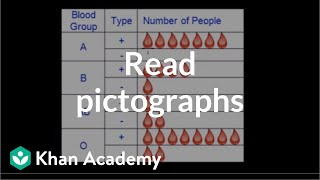
By Khan Academy
Common sense tells you that a pictograph must be some kind of....picture. Yes! A pictograph is basically a way to represent data with pictures that relate to the data. Let's look at this word problem that asks to interpret a pictograph.

12 - What are Inverse Functions? (Part 1) - Find the Inverse of a Function & Graph
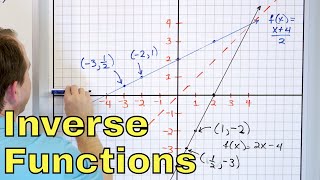
By Math and Science
Quality Math And Science Videos that feature step-by-step example problems!