Lumos Video Store
This page provides a list of educational videos related to Measurement Data. You can also use this page to find sample questions, apps, worksheets, lessons , infographics and presentations related to Measurement Data.
Understanding Measurement Data Displayed in Line Plots: 2.MD.9

By Tenmarks Amazon
Students learn how to interpret measurement data displayed in line plots.
[4.MD.4-1.0] Fractional Line Plots - Common Core Standard
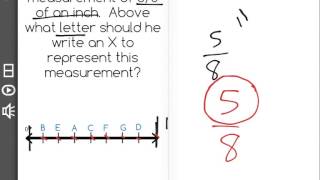
By Freckle education
Make a line plot to display a data set of measurements in fractions of a unit (1/2, 1/4, 1/8)
Introduction to line plots | Measurement and data | Early Math | Khan Academy
By KhanAcademy
Explanation about line plots
The Measures of Central Tendency Rap
By Paul Devoto
Watch this rap to help yourself remember the measures of central tendency for a set of data. For different data sets, one measure maybe a better representation of the "center" of the data than another. This must be determined based on the spread and availability of the data.
[3.MD.4-1.0] Visual Representations of Data - Common Core Standard

By Freckle education
Generate measurement data by measuring lengths using rulers marked with halves and fourths of an inch.


Range, variance and standard deviation as measures of dispersion
By Khan Academy
This video goes over the main ways we measure dispersion of data, then shows those vlaues for two different data sets. Remember that simply comparing the means or medians of two data sets is not sufficient to fully compare the data. Understanding how data is arranged about the "center" of the data is also critical in understand and comparing the sets
6.SP.5.b - Describe Attributes of Data

By MathwithMrAlmeida
In this video, Mr. Almeida explains how to describe what attribute the data is measuring, how the data was measured and what the unit the f measurement is. This video addresses the Common Core Standards for Mathematics Grade 6 indicator of 6.SP.5.b.
Measurement and Data - Grade 4 Math Educational Video (4.MD.3)

By Lumos Learning
Using the Lumos Study Programs, parents and educators can reinforce the classroom learning experience for children and help them succeed at school and on the standardized tests. Lumos books, dvd, eLearning and tutoring are used by leading schools, libraries and thousands of parents to supplement classroom learning and improve student achievement in the standardized tests.
PARENTS please visit LumosTestPrep.com to learn more.
EDUCATORS please visit LumosLearning.com to learn more
Measurement and Data - Grade 3 Math Educational Video (3.MD.B.4)

By Lumos Learning
Using the Lumos Study Programs, parents and educators can reinforce the classroom learning experience for children and help them succeed at school and on the standardized tests. Lumos books, dvd, eLearning and tutoring are used by leading schools, libraries and thousands of parents to supplement classroom learning and improve student achievement in the standardized tests.
PARENTS please visit LumosTestPrep.com to learn more.
EDUCATORS please visit LumosLearning.com to learn more
Measurement and Data - Grade 5 Math Educational Video (5.MD.3a)

By Lumos Learning
Using the Lumos Study Programs, parents and educators can reinforce the classroom learning experience for children and help them succeed at school and on the standardized tests. Lumos books, dvd, eLearning and tutoring are used by leading schools, libraries and thousands of parents to supplement classroom learning and improve student achievement in the standardized tests.
PARENTS please visit LumosTestPrep.com to learn more.
EDUCATORS please visit LumosLearning.com to learn more
[6.SP.5b-1.0] Methods of Data Collection - Common Core Standard

By Freckle by Renaissance
Summarize numerical data sets in relation to their context by describing the nature of the attribute under investigation, including how it was measured and its units of measurement. Front Row is a free, adaptive, Common Core aligned math program for teachers and students in kindergarten through eighth grade. Front Row allows students to practice math at their own pace - learning advanced concepts when they're ready and receiving remediation when they struggle. Front Row provides teachers with access to a detailed data dashboard and weekly email reports that show which standards are causing students difficulty, what small groups can be formed for interventions, and how their students are progressing in math.
6.SP.5.a - Report the Number of Observations in a Data Set

By MathwithMrAlmeida
In this video, Mr. Almeida explains how to report the number of observations, or the n, in a data set. This is very important, as it is the foundation for being able to find statistical measures such as mean and mean absolute deviation. This address Common Core Standards for Mathematics indicator 6.SP.5.a.
[6.SP.5d-1.0] Best Measure of Center and Variability - Common Core Standard

By Freckle by Renaissance
Summarize numerical data sets in relation to their context by relating the choice of measures of center and variability to the shape of the data distribution Front Row is a free, adaptive, Common Core aligned math program for teachers and students in kindergarten through eighth grade. Front Row allows students to practice math at their own pace - learning advanced concepts when they're ready and receiving remediation when they struggle. Front Row provides teachers with access to a detailed data dashboard and weekly email reports that show which standards are causing students difficulty, what small groups can be formed for interventions, and how their students are progressing in math.
Improve oral reading fluency for children with Lumos Reading Buddy

By Lumos
In this video, Darcy gives you a walkthrough of Lumos Reading Buddy. This revolutionary online oral reading fluency program allows children to enjoy engaging stories while gaining confidence, improving vocabulary, acing reading comprehension, and reading fluently. The online program integrates speech processing technologies with machine learning to provide empathetic oral reading fluency support for children. It relies on research-based methodologies such as independent reading, repeated reading, teacher modeling, rigorous vocabulary practice, and reading comprehension quiz! The fluency data from the repeated reading cycles are immediately accessible to both parents and learners for measurement and positive reinforcement. Subscribe to the Lumos Reading Buddy Program today and turn your kids into successful readers!
Improve oral reading fluency for children with Lumos Reading Buddy

By Lumos Learning
In this video, Darcy gives you a walkthrough of Lumos Reading Buddy. This revolutionary online oral reading fluency program allows children to enjoy engaging stories while gaining confidence, improving vocabulary, acing reading comprehension, and reading fluently. The online program integrates speech processing technologies with machine learning to provide empathetic oral reading fluency support for children. It relies on research-based methodologies such as independent reading, repeated reading, teacher modeling, rigorous vocabulary practice, and reading comprehension quiz! The fluency data from the repeated reading cycles are immediately accessible to both parents and learners for measurement and positive reinforcement. Subscribe to the Lumos Reading Buddy Program today and turn your kids into successful readers!
Line plots and stem-and-leaf plots
By MathPlanetVideos
Construct a stem-and-leaf plot out of the following data: 6, 6,7,8,9,13,16,19,21,25,26