Lumos Video Store
This page provides a list of educational videos related to Make a Table - Data. You can also use this page to find sample questions, apps, worksheets, lessons , infographics and presentations related to Make a Table - Data.
How to Make a Frequency Table

By TheMathClips
This short video demonstrates how to organize data into a frequency table, making it easier to interpret or make into a graph.
How to Make a Frequency Table
By TheMathClips
This short video demonstrates how to organize data into a frequency table, making it easier to interpret or make into a graph.
How to Make a Frequency Table
By TheMathClips
This short video demonstrates how to organize data into a frequency table, making it easier to interpret or make into a graph.
Math Lessons & Study Tips : How To Make A Frequency Table

By eHow
A frequency table is created to give a certain piece of data, such as how many siblings each member of a classroom has. Find out how to make and interpret a frequency table with help from a tutor in this free video on math lessons and study tips.
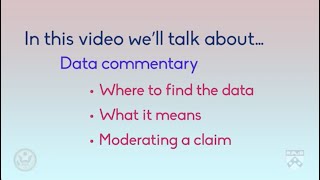
Language Focus: Data Commentary
By
In this video, we'll look at describing data in tables and figures. This process is how a journalist can tell people what the numbers and figures in an article mean. We call this data commentary. We'll look at three things: where to find the data, what it means, and moderating a claim.


Contingency table chi-square test | Probability and Statistics | Khan Academy

By Khan Academy
Hypothesis tests on contingency tables are based on the Chi-square. The term "chi-square" refers both to a statistical distribution and to a hypothesis testing procedure that produces a statistic that is approximately distributed as the chi-square distribution.

ALL OF GRADE 9 MATH IN 60 MINUTES!!! (exam review part 2)

By Lumos Learning
Here is a great exam review video reviewing all of the main concepts you would have learned in the MPM1D grade 9 academic math course. The video is divided in to 3 parts. This is part 2: Linear Relations. In this video you will review everything there is to know about y=mx+b, scatterplots, and distance time graphs.
11th Grade Mathematics

By
11th grade math lesson in which students interpret linear models and the correlation coefficient, and make predictions based on data.
8th Grade Math

By Lumos Learning
8th grade math lesson addressing Common Core Standards (Massachusetts Curriculum Framework Standard 8.EE.6).
8th Grade Math

By
8th grade math lesson addressing Common Core Standards (Massachusetts Curriculum Framework Standard 8.EE.6).


