Lumos Video Store
This page provides a list of educational videos related to Line Plots. You can also use this page to find sample questions, apps, worksheets, lessons , infographics and presentations related to Line Plots.
Line Plots for Fractions
By Icon Math
Make line plots to display measurements in fractions of a unit.
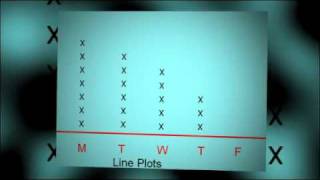
graphs and data line plot -"dot plots"

By Joann's School
Learn how to read and create a Line Plot (Dot Plot)
Interpreting Line plots
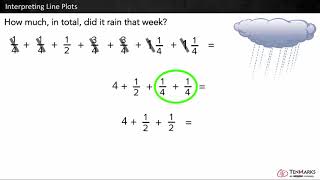
By Tenmarks Amazon
Students learn to interpret line plots by using the given data to answer questions involving fractions and whole numbers.
How to read a line plot that uses fractions | 4th grade | Khan Academy
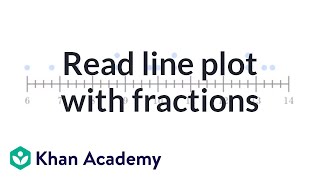
By KhanAcademy
Explanation about line plots
[4.MD.4-1.0] Fractional Line Plots - Common Core Standard
By Freckle education
Make a line plot to display a data set of measurements in fractions of a unit (1/2, 1/4, 1/8)
Introduction to line plots | Measurement and data | Early Math | Khan Academy
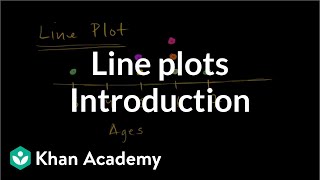
By KhanAcademy
Explanation about line plots
Understanding Measurement Data Displayed in Line Plots: 2.MD.9

By Tenmarks Amazon
Students learn how to interpret measurement data displayed in line plots.
Plot Fractions on the Number Line
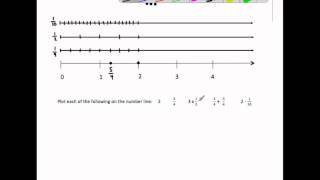
By MathwithMrAlmeida
This video plots 6 fractions and operations with fractions on the number line. It ends by plotting all the same fractions on the number line and identify a pair of equivalent fractions and comparing each number's distance from zero.
Line plots and stem-and-leaf plots
By MathPlanetVideos
Construct a stem-and-leaf plot out of the following data: 6, 6,7,8,9,13,16,19,21,25,26
Plotting Fractions on a Number Line
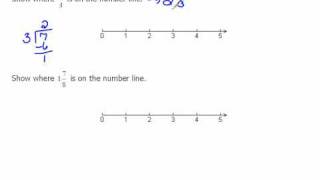
By mathlablady4
The instructor first reviews how to plot whole numbers on a number line. She then relates the same concept to fractions. In the video lesson she plots both proper and improper fractions. Very clear instruction and easy for students to visualize the concept.
Solving problems with line plots 1
By Khan Academy
Create a line plot from a set of data. ������������Use the line plot to answer questions.
How to read a line plot that uses fractions | 4th grade | Khan Academy
By Khan Academy
Learn how to read a line plot that records average monthly rainfall for various cities.
An introduction to geometry
By MathPlanetVideos
Plot a pint, a line, a line segment and an angle in a coordinate plane.
Creating frequency tables

By Khan Academy
In this video, we organize data into frequency tables and dot plots (sometimes called line plots).
Creating dot plots
By Khan Academy
In this video, we organize data into frequency tables and dot plots (sometimes called line plots).

Inequalities on a number line
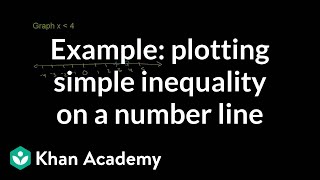
By Khan Academy
Learn how to plot a simple inequality on a number line. The example used in this video is x < 4.
Ex: Matching Correlation Coefficients to Scatter Plots

By Mathispower4u
Ex: Matching Correlation Coefficients to Scatter Plots
