Lumos Video Store
This page provides a list of educational videos related to Draw and Analyze Line Plots. You can also use this page to find sample questions, apps, worksheets, lessons , infographics and presentations related to Draw and Analyze Line Plots.
[4.MD.4-1.0] Fractional Line Plots - Common Core Standard
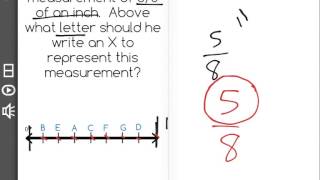
By Freckle education
Make a line plot to display a data set of measurements in fractions of a unit (1/2, 1/4, 1/8)
Line plots and stem-and-leaf plots
By MathPlanetVideos
Construct a stem-and-leaf plot out of the following data: 6, 6,7,8,9,13,16,19,21,25,26
Box and Whisker Plots : Skewness and Outliers. : ExamSolutions
By ExamSolutions
Youtube Presents Box and Whisker Plots : Skewness and Outliers. : ExamSolutions an educational video resources on statistics.
Ex: Matching Correlation Coefficients to Scatter Plots

By Mathispower4u
Ex: Matching Correlation Coefficients to Scatter Plots
Plot and Subplots: Creative Fiction Writing

By Cy Porter
Find and map out the plot and all the subplots in your story. Work on them separately to improve your story. It's better to look at each subplot separated from the rest of the story. Use subplot to make three dimensional characters.

Stem and Leaf Plots in Statistics

By mathtutordvd
In this lesson, you'll learn what a stem-and-leaf plot is in statistics is and why it is important.
Stem and Leaf Plots and Histograms: An Application (Algebra I)

By CK-12 Foundation
This video demonstrates a sample use of stem-and-leaf plots and histograms.
What are Quartiles and Boxplots

By StraighterLine
YouTube presents What are Quartiles and Boxplots, an educational video resource on statistics and probability.


Interpreting Line plots
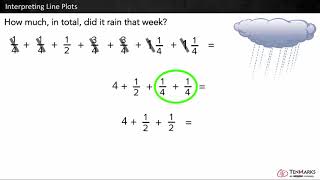
By Tenmarks Amazon
Students learn to interpret line plots by using the given data to answer questions involving fractions and whole numbers.
Understanding Measurement Data Displayed in Line Plots: 2.MD.9

By Tenmarks Amazon
Students learn how to interpret measurement data displayed in line plots.
Line Plots for Fractions
By Icon Math
Make line plots to display measurements in fractions of a unit.
graphs and data line plot -"dot plots"

By Joann's School
Learn how to read and create a Line Plot (Dot Plot)
Introduction to line plots | Measurement and data | Early Math | Khan Academy
By KhanAcademy
Explanation about line plots
Plot and Subplots: Creative Fiction Writing
By Cy Porter
Find and map out the plot and all the subplots in your story. Work on them separately to improve your story. It's better to look at each subplot separated from the rest of the story. Use subplot to make three dimensional characters.
I can compare and contrast the themes, settings and plots of stories by the same author

By 3rd Grade ELA team
Compare and contrast the themes, settings, and plots of stories written by the same author about the same or similar characters.
Statistics: Parallel Boxplots (Univariate Data)

By Educator
Watch more at http://www.educator.com/mathematics/statistics/yates/ Other subjects include Calculus, Biology, Chemistry, Physics, Algebra 1/2, Basic Math, Trigonometry, Pre-Calculus, Geometry, Pre-Algebra, Organic Chemistry, and Computer Science. -All lectures are broken down by individual topics -No more wasted time -Just search and jump directly to the answer