Lumos Video Store
This page provides a list of educational videos related to Draw Scaled Picture Graphs. You can also use this page to find sample questions, apps, worksheets, lessons , infographics and presentations related to Draw Scaled Picture Graphs.
[2.MD.10-1.0] Picture and Bar Graphs - Common Core Standard

By Freckle education
Draw a picture graph and bar graph (with single-unit scale) to represent a data set with up to four categories.
Charts Maps and Graphs: Finding Treasure - YouTube

By sedl
Charts Maps and Graphs: Finding Treasure - YouTube
Building Scaled Picture Graphs: 3.MD.3

By TenMarks Amazon
Students learn the parts of a picture graph to build scaled picture graphs based on given data.
Graphs for 2nd grade - pictograph and bar graph
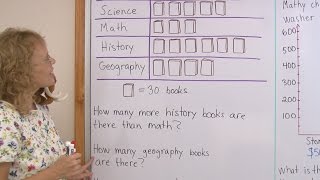
By mathmamoth
a pictograph (or a pictogram) and a bar graph. The pictograph has to do with books in a library, and one symbol of a 'book' means 30 books.
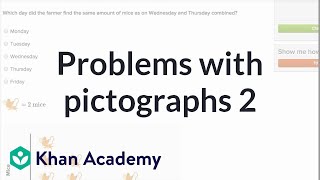
Solving problems with picture graphs 1

By Khan Academy
Read and interpret a picture graph.������������
graphs and data line plot -"dot plots"

By Joann's School
Learn how to read and create a Line Plot (Dot Plot)
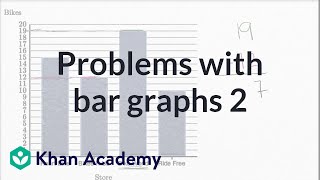
More solving problems with bar graphs | Fractions | 3rd grade

By Khan Academy
Interpret bar graphs to answer questions about a context.
Reading pictographs
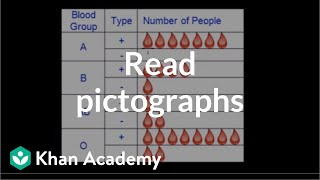
By Khan Academy
Common sense tells you that a pictograph must be some kind of....picture. Yes! A pictograph is basically a way to represent data with pictures that relate to the data. Let's look at this word problem that asks to interpret a pictograph.
Grade 3 Math - Graphs

By Lumos Learning
Using the Lumos Study Programs, parents and educators can reinforce the classroom learning experience for children and help them succeed at school and on the standardized tests. Lumos books, dvd, eLearning and tutoring are used by leading schools, libraries and thousands of parents to supplement classroom learning and improve student achievement in the standardized tests.
Velocity Time Graphs, Acceleration & Position Time Graphs - Physics

By The Organic Chemistry Tutor
This physics video tutorial provides a basic introduction into motion graphs such as position time graphs, velocity time graphs, and acceleration time graphs. It explains how to use area and slope to calculate the velocity, acceleration, displacement, and whether if the particle is speeding up or slowing down. It also explains how to determine if the velocity is increasing or if the acceleration is positive.
15 - What is a Logarithm (Log x) Function? (Calculate Logs, Applications, Log Bases)

By Math and Science
Quality Math And Science Videos that feature step-by-step example problems!
Learn Graphing, Coordinate Plane, Points, Lines, X-Axis, Y-Axis & Ordered Pairs - [5-7-1]

By Math and Science
Quality Math And Science Videos that feature step-by-step example problems!
11th Grade Mathematics

By
11th grade math lesson in which students interpret linear models and the correlation coefficient, and make predictions based on data.
07 - What is an Exponential Function? (Exponential Growth, Decay & Graphing).
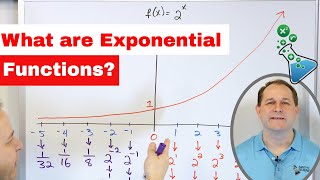
By Math and Science
Quality Math And Science Videos that feature step-by-step example problems!
01 - Direct Variation and Proportion in Algebra - Part 1 (Constant of Variation & More)

By Math and Science
Quality Math And Science Videos that feature step-by-step example problems!