Lumos Video Store
This page provides a list of educational videos related to Data Distributions. You can also use this page to find sample questions, apps, worksheets, lessons , infographics and presentations related to Data Distributions.
Interpreting and comparing data distributions
By Khan Academy
Interpreting and comparing data distributions
Interpreting and comparing data distributions
By Khan Academy
Interpreting and comparing data distributions
Interpreting and comparing data distributions
By Khan Academy
Interpreting and comparing data distributions
Interpreting and comparing data distributions
By Khan Academy
Interpreting and comparing data distributions
Interpreting and comparing data distributions
By Khan Academy
Interpreting and comparing data distributions
Interpreting and comparing data distributions
By Khan Academy
Interpreting and comparing data distributions
Understanding Data Distributions Using a Normal Distribution Curve

By PatrickJMT
The Normal Distribution and the 68-95-99.7 Rule. In this video, I talk about the normal distribution and what percentage of observed values fall within either 1, 2, or 3 standard deviations from the mean. One specific example is discussed. For more free math video, visit http://PatrickJMT.com
By Khan Academy
Some distributions are symmetrical, with data evenly distributed about the mean. Other distributions are skewed, with data tending to the left or right of the mean. We sometimes say that skewed distributions have tails.,1211
Understanding Data Distributions Using a Normal Distribution Curve
By PatrickJMT
The Normal Distribution and the 68-95-99.7 Rule. In this video, I talk about the normal distribution and what percentage of observed values fall within either 1, 2, or 3 standard deviations from the mean. One specific example is discussed. For more free math video, visit http://PatrickJMT.com
[6.SP.5d-1.0] Best Measure of Center and Variability - Common Core Standard

By Freckle by Renaissance
Summarize numerical data sets in relation to their context by relating the choice of measures of center and variability to the shape of the data distribution Front Row is a free, adaptive, Common Core aligned math program for teachers and students in kindergarten through eighth grade. Front Row allows students to practice math at their own pace - learning advanced concepts when they're ready and receiving remediation when they struggle. Front Row provides teachers with access to a detailed data dashboard and weekly email reports that show which standards are causing students difficulty, what small groups can be formed for interventions, and how their students are progressing in math.
[7.SP.3-2.0] Assessing Data Overlap - Common Core Standard

By Front Row
Discover more Common Core Math at https://www.frontrowed.com Measure the difference between the centers of two numerical data distributions with similar variabilities by expressing it as a multiple of a measure of variability Front Row is a free, adaptive, Common Core aligned math program for teachers and students in kindergarten through eighth grade. Front Row allows students to practice math at their own pace - learning advanced concepts when they're ready and receiving remediation when they struggle. Front Row provides teachers with access to a detailed data dashboard and weekly email reports that show which standards are causing students difficulty, what small groups can be formed for interventions, and how their students are progressing in math. Discover more Common Core Math at https://www.frontrowed.com

[3.OA.5-2.0] Multiplication Properties - Common Core Standard

By Front Row
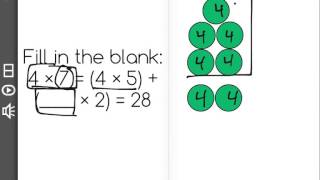
Discover more Common Core Math at https://www.frontrowed.comApply properties of operations as strategies to divide.2 Examples: If 6 × 4 = 24 is known, then 4 × 6 = 24 is also known. (Commutative property of multiplication.) 3 × 5 × 2 can be found by 3 × 5 = 15, then 15 × 2 = 30, or by 5 × 2 = 10, then 3 × 10 = 30. (Associative property of multiplication.) Knowing that 8 × 5 = 40 and 8 × 2 = 16, one can find 8 × 7 as 8 × (5 2) = (8 × 5) (8 × 2) = 40 16 = 56. (Distributive property.)Front Row is a free, adaptive, Common Core aligned math program for teachers and students in kindergarten through eighth grade. Front Row allows students to practice math at their own pace - learning advanced concepts when they 're ready and receiving remediation when they struggle. Front Row provides teachers with access to a detailed data dashboard and weekly email reports that show which standards are causing students difficulty, what small groups can be formed for interventions, and how their students are progressing in math.Discover more Common Core Math at https://www.frontrowed.com
[3.OA.5-1.0] Multiplication Properties - Common Core Standard
By Front Row
Discover more Common Core Math at https://www.frontrowed.comApply properties of operations as strategies to multiply.2 Examples: If 6 × 4 = 24 is known, then 4 × 6 = 24 is also known. (Commutative property of multiplication.) 3 × 5 × 2 can be found by 3 × 5 = 15, then 15 × 2 = 30, or by 5 × 2 = 10, then 3 × 10 = 30. (Associative property of multiplication.) Knowing that 8 × 5 = 40 and 8 × 2 = 16, one can find 8 × 7 as 8 × (5 2) = (8 × 5) (8 × 2) = 40 16 = 56. (Distributive property.)Front Row is a free, adaptive, Common Core aligned math program for teachers and students in kindergarten through eighth grade. Front Row allows students to practice math at their own pace - learning advanced concepts when they 're ready and receiving remediation when they struggle. Front Row provides teachers with access to a detailed data dashboard and weekly email reports that show which standards are causing students difficulty, what small groups can be formed for interventions, and how their students are progressing in math.Discover more Common Core Math at https://www.frontrowed.com
Trigonometric Substitution
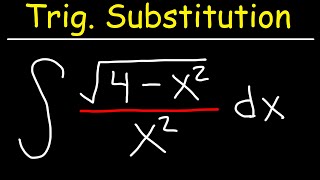
By The Organic Chemistry Tutor
This calculus video tutorial provides a basic introduction into trigonometric substitution. It explains when to substitute x with sin, cos, or sec. It also explains how to perform a change of variables using u-substitution integration techniques and how to use right triangle trigonometry with sohcahtoa to convert back from angles in the form of theta to an x variable. There's plenty of examples and practice problems in this lesson.


What is a Map? Crash Course Geography #2

By Math and Science
Quality Math And Science Videos that feature step-by-step example problems!