Lumos Video Store
This page provides a list of educational videos related to Analyzing Relationships. You can also use this page to find sample questions, apps, worksheets, lessons , infographics and presentations related to Analyzing Relationships.
Diction and Imagery

By EnglishI PLC
This slideshow video explores the relationship between diction and imagery in a text. Through several examples it analyzes how word choice can affect tone. The examples include a passage from "The Catcher in the Rye".
Diction and Imagery
By EnglishI PLC
This slideshow video explores the relationship between diction and imagery in a text. Through several examples it analyzes how word choice can affect tone. The examples include a passage from "The Catcher in the Rye".
Sketching Quadratic Graphs : ExamSolutions
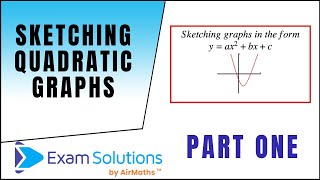
By ExamSolutions
An in depth look at sketching quadratics
Relationships between sq pyramids and sq prisms part 2
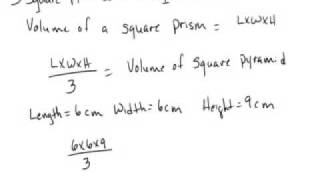
By TeacherTube Math
http://www.teachertube.com Using the relationships between square pyramids and square prisms to find a formula for volume of a square pyramid
Graphs for 2nd grade - pictograph and bar graph
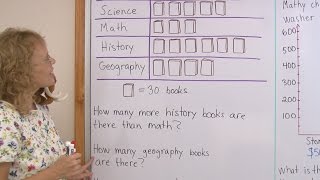
By mathmamoth
a pictograph (or a pictogram) and a bar graph. The pictograph has to do with books in a library, and one symbol of a 'book' means 30 books.
Recognizing functions from graphs

By Khan Academy
Sal checks whether a given set of points can represent a function. For the set to represent a function, each domain element must have one corresponding range element at most.
Graphs Of Square Root Functions
By Khan Academy
This Khan Academy video offers more information on graphing square root functions and contains a few sample problems with a step-by-step walkthrough on graphing these functions.
Ex: Domain of Composite Function From Graphs

By Mathispower4u
Ex: Domain of Composite Function From Graphs
Function inverse example 1 | Functions and their graphs | Algebra II | Khan Academy
By Khan Academy
Function Inverse Example 1
Function inverses example 3 | Functions and their graphs | Algebra II | Khan Academy
By Khan Academy
Function Inverse Example 3: f(x)= (x - 1) squared -2 This is the last segment of Mr. Khan's short 4-part series on Function Inverses. These installments started with Khan's Introduction to Function Inverses. Mr. Khan uses the Paint Program (with different colors) to illustrate his points. Sal Khan is the recipient of the 2009 Microsoft Tech Award in Education. The screen gets busy (and dark)--the viewer may want to open to 'full screen' to see everything. The sound is a little low.
Introduction to function inverses | Functions and their graphs | Algebra II | Khan Academy
By Khan Academy
Introduction to Function Inverses. Mr. Khan uses the Paint Program (with different colors) to illustrate his points. Sal Khan is the recipient of the 2009 Microsoft Tech Award in Education. The screen gets busy (and dark)--the viewer may want to open to 'full screen' to see everything. The sound is a little low.
Polynomial Functoions and Their Graphs

By R Parsons
This is a video on polynomials and how to graph them. It also includes a discussion of various properties of their graphs.
eSpark Learning Proportional Graphs Framing Video (8.EE, Quest 7)

By eSparkLearningVideos
Graph and compare proportional videos after watching this video.
Solving problems with picture graphs 1

By Khan Academy
Read and interpret a picture graph.������������
Graphs for Real, Complex, Quaternions, and Hypercomplex Numbers

By Doug Sweetser
Graphs for Real, Complex, Quaternions, and Hypercomplex Numbers
More trig graphs

By Khan Academy
This video lecture series from Khan Academy on Trigonometry includes Radians and Degrees, Using Trigonometric Functions, The Unit Circle definition of trigonometric function, Graph of the Sine Function, graphs of Trigonometric Functions, Trigonometric Identities, Law of Cosines, Law of Sines, Polar Coordinates and Trigonometric Word Problems.
Recognizing functions from graphs

By Khan Academy
Sal explains why a vertical line *doesn't* represent a function.
graphs and data line plot -"dot plots"

By Joann's School
Learn how to read and create a Line Plot (Dot Plot)
Match graphs of rational functions to their formula
By Khan Academy
Sal matches three graphs of rational functions to three formulas of such functions by considering asymptotes and intercepts.