Lumos Video Store
This page provides a list of educational videos related to 8.SP. You can also use this page to find sample questions, apps, worksheets, lessons , infographics and presentations related to 8.SP.
8 sp 1

By SEDL
This mathematics video is from the Common Core State Standards Video Series at http://secc.sedl.org/common_core_videos/
Statistics & Probability - Grade 8 Math Educational Video (8.SP.1)

By Lumos Learning
Using the Lumos Study Programs, parents and educators can reinforce the classroom learning experience for children and help them succeed at school and on the standardized tests. Lumos books, dvd, eLearning and tutoring are used by leading schools, libraries and thousands of parents to supplement classroom learning and improve student achievement in the standardized tests.
PARENTS please visit LumosTestPrep.com to learn more.
EDUCATORS please visit LumosLearning.com to learn more
7.SP.8.b - List Possible Outcomes for Compound Events
By MathwithMrAlmeida
If you've ever been at a restaurant and seen choices for an appetizer, main dish and dessert, have you ever wondered what could the outcomes be if you had to pick one of each from the choices you had? In this video, Mr. Almeida shows you how to list the possible outcomes of compound events. This video addresses the modeling of how to find the possible outcomes using tree diagrams, as called for in Common Core math standard 7.SP.8.b. This is not asking how many combinations are possible, but rather it is a lesson in WHAT the outcomes are.


eSpark Learning: Construct and Interpret Scatter Plots Framing Video (Fa13 8.SP Quest 1)

By eSparkLearningVideos


Grade 8 Math Multiple Choice Sample Question - LumosTestPrep.com LumosLearning.com

By Lumos Learning
Using the Lumos Study Programs, parents and educators can reinforce the classroom learning experience for children and help them succeed at school and on the standardized tests. Lumos books, dvd, eLearning and tutoring are used by leading schools, libraries and thousands of parents to supplement classroom learning and improve student achievement in the standardized tests.
PARENTS please visit LumosTestPrep.com to learn more.
EDUCATORS please visit LumosLearning.com to learn more
Comparing probabilities

By Khan Academy
Think about what probabilities really mean. What does a probability of 0 mean? How about 1?
Grade 8 Math Multiple Choice Sample Question - LumosTestPrep.com LumosLearning.com
By Lumos Learning
Using the Lumos Study Programs, parents and educators can reinforce the classroom learning experience for children and help them succeed at school and on the standardized tests. Lumos books, dvd, eLearning and tutoring are used by leading schools, libraries and thousands of parents to supplement classroom learning and improve student achievement in the standardized tests.
PARENTS please visit LumosTestPrep.com to learn more.
EDUCATORS please visit LumosLearning.com to learn more
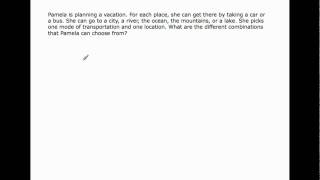
Grade 7 Math Extended Constructed Response Sample Question - LumosTestPrep.com LumosLearning.com

By Lumos Learning
Using the Lumos Study Programs, parents and educators can reinforce the classroom learning experience for children and help them succeed at school and on the standardized tests. Lumos books, dvd, eLearning and tutoring are used by leading schools, libraries and thousands of parents to supplement classroom learning and improve student achievement in the standardized tests.
PARENTS please visit LumosTestPrep.com to learn more.
EDUCATORS please visit LumosLearning.com to learn more
Creating a Scatter Plot

By TheMathClips
This video demonstrates how to take data from a chart (ordered pairs) and display it in a scatter plot.
Summarizing Bivariate Data

By Kevin Dorey
9:33 video explains the difference between numerical and categorical data then shows the difference between several examples of univariate and bivariate data. Finally gives an example of data represented in a table. Example is of science project grades/scores.
Interpreting Scatterplots

By vcefurthermaths
VCE Further Maths Tutorials. Core (Data Analysis) Tutorial 17: Interpreting Scatterplots. Starts with a description of how to plot a scatterplot from a table. At the 2:24 mark it talks about how to interpret scatterplots in terms of direction form strength and outliers.
Reading Pie Graphs (Circle Graphs) - Khan Academy

By Khan Academy
While pie charts (or circle graphs) are often easy to read they are more difficult to put into percentages since that usually involves fractions. When used to initially teach fractions this process usually is a bit easier. Use the easy to understand video in this learning to explain to students how to read pie charts (circle graphs).