Lumos Video Store
This page provides a list of educational videos related to Use Scale Drawings. You can also use this page to find sample questions, apps, worksheets, lessons , infographics and presentations related to Use Scale Drawings.
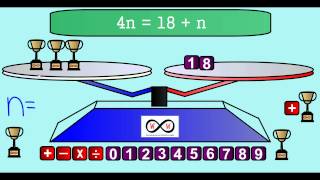
Algebra - Equations on a Balance Scale (6-EE-A-2, 6-EE-B-5, 6-EE-B-6)
By Worksheets and Walkthroughs
This video walkthrough lesson guides you through the process of using a balance scale and manipulatives as visual representations of an equation with a variable representing an unknown value. The solution is also represented as a tape diagram/model drawing. A story problem is also given to provide a meaningful context. (6-EE-A-2, 6-EE-B-5, 6-EE-B-6)
[2.MD.10-1.0] Picture and Bar Graphs - Common Core Standard

By Freckle education
Draw a picture graph and bar graph (with single-unit scale) to represent a data set with up to four categories.
Charts Maps and Graphs: Finding Treasure - YouTube

By sedl
Charts Maps and Graphs: Finding Treasure - YouTube
Building Scaled Picture Graphs: 3.MD.3

By TenMarks Amazon
Students learn the parts of a picture graph to build scaled picture graphs based on given data.
graphs and data line plot -"dot plots"

By Joann's School
Learn how to read and create a Line Plot (Dot Plot)

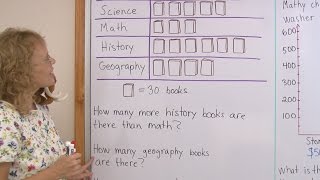
Graphs for 2nd grade - pictograph and bar graph
By mathmamoth
a pictograph (or a pictogram) and a bar graph. The pictograph has to do with books in a library, and one symbol of a 'book' means 30 books.
Solving problems with picture graphs 1

By Khan Academy
Read and interpret a picture graph.������������
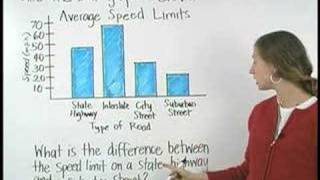
Bar Graphs- Pre Algebra Help
By yourteachermathhelp
Students learn that a bar graph is a visual way to display and compare numerical data (such as the population of different southern states). The bars of a bar graph are drawn in relation to a horizontal axis and a vertical axis and a bar graph can have either vertical or horizontal bars. Students are then asked to create bar graphs using given data and answer questions based on given bar graphs.
More solving problems with bar graphs | Fractions | 3rd grade

By Khan Academy
Interpret bar graphs to answer questions about a context.
What is a Map? Crash Course Geography #2

By Math and Science
Quality Math And Science Videos that feature step-by-step example problems!
15 - What is a Logarithm (Log x) Function? (Calculate Logs, Applications, Log Bases)

By Math and Science
Quality Math And Science Videos that feature step-by-step example problems!
Learn Equilateral, Scalene & Isosceles Triangles and Acute, Obtuse & Right Triangles - [15]
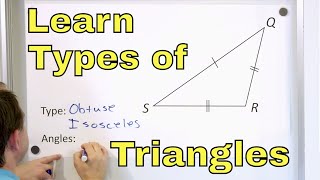
By Math and Science
Learn Equilateral, Scalene & Isosceles Triangles and Acute, Obtuse & Right Triangles - [15]
By Math and Science
Quality Math And Science Videos that feature step-by-step example problems!