Lumos Video Store
This page provides a list of educational videos related to Problem-Solving Using a Table. You can also use this page to find sample questions, apps, worksheets, lessons , infographics and presentations related to Problem-Solving Using a Table.
Mixture Problems: Solutions with Various Concentrations II

By Khan Academy
The instructor in this video Sal Khan continues to discuss solving mixture problems. This problem involves percentages and how to use a table to help solve the problem. Mr. Khan uses the Paint Program (with different colors) to illustrate his points. Sal Khan is the recipient of the 2009 Microsoft Tech Award in Education. The student or educator may want to open the video to 'full screen' as the instructor is using a black background and the writing is small.
Mixture problems: Solutions of Various Concentrations
By Khan Academy
The instructor in this video Sal Khan continues to discuss solving mixture problems. This problem involves percentages and how to use a table to help solve the problem. Mr. Khan uses the Paint Program (with different colors) to illustrate his points. Sal Khan is the recipient of the 2009 Microsoft Tech Award in Education. The student or educator may want to open the video to 'full screen' as the instructor is using a black background and the writing is small.
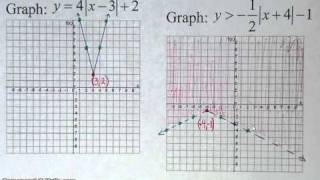
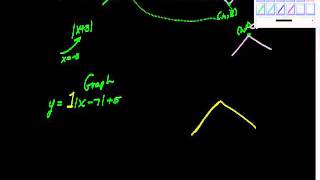
Quickly Graph Absolute Value Functions
By WOWmath.org
YouTube presents Quickly Graph Absolute Value Functions, an educational video resource on math.
Graph Functions and Relations
By MathPlanetVideos
This video from MathPlanet provides an overview of algebraic concepts related to graphing functions and relations.
Graph Functions and Relations
By MathPlanetVideos
This video from MathPlanet provides an overview of algebraic concepts related to graphing functions and relations.
Graphing Cube Root Functions
By drmikedcook
This video explains explains how to graph cube root functions.
Graphing Absolute Value Functions Pt III
By charlie Lindelof
YouTube presents Graphing Absolute Value Functions Pt III, an educational video resource on mathematics.
Ex: Find Function Output and Input Using a Graph, Table, Ordered Pairs, and Function Rule
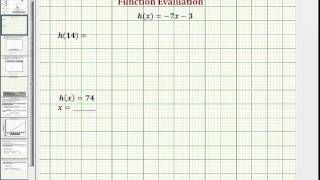
By Mathispower4u
Ex: Find Function Output and Input Using a Graph, Table, Ordered Pairs, and Function Rule
Graphing Quadratic Functions - Example 1
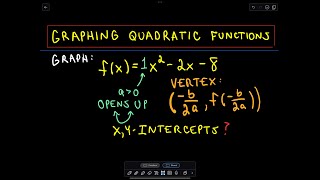
By PatrickJMT
Watch this video to learn how to graph a quadratic function of the form ax2 +bx + c, where a, b, and c are constants (and a≠0). All functions of this form describe the graph of a parabola (u-shape) that either opens upward or downward. To graph a quadratic function: Consider the leading coefficient (the value of a) to determine if the parabola opens upward (postive a) or downward (negative a) Calculate the vertex of the parabola from a and b. The vertex is the highest or lowest point of the parabola. Find the x-intercept(s) (zeros) Find the y-intercept. (Found by plugging x=0 into the function).
Recognizing functions from graphs

By Khan Academy
Sal checks whether a given set of points can represent a function. For the set to represent a function, each domain element must have one corresponding range element at most.
Ex: Determine if a Function is Incr, Decr, or Constant from Graph, Table, and Ordered Pairs
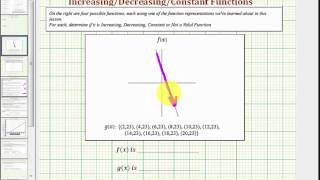
By Mathispower4u
Ex: Determine if a Function is Incr, Decr, or Constant from Graph, Table, and Ordered Pairs
Graphs Of Square Root Functions
By Khan Academy
This Khan Academy video offers more information on graphing square root functions and contains a few sample problems with a step-by-step walkthrough on graphing these functions.
Recognizing functions from graphs

By Khan Academy
Sal explains why a vertical line *doesn't* represent a function.
4th Grade Spatial Reasoning with Polygons

By
4th grade math lesson on spatial reasoning with polygons, aligned to MA Curriculum Framework Standard 4.OA.5.

Sketching Quadratic Graphs : ExamSolutions
By ExamSolutions
An in depth look at sketching quadratics
Function inverse example 1 | Functions and their graphs | Algebra II | Khan Academy
By Khan Academy
Function Inverse Example 1