Lumos Video Store
This page provides a list of educational videos related to Dot Graphs. You can also use this page to find sample questions, apps, worksheets, lessons , infographics and presentations related to Dot Graphs.
graphs and data line plot -"dot plots"

By Joann's School
Learn how to read and create a Line Plot (Dot Plot)
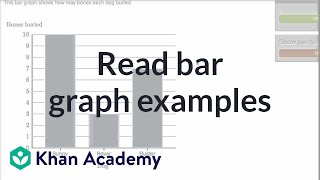
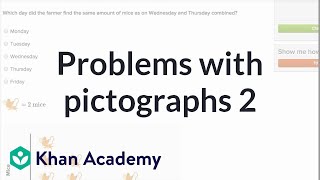
[2.MD.10-1.0] Picture and Bar Graphs - Common Core Standard

By Freckle education
Draw a picture graph and bar graph (with single-unit scale) to represent a data set with up to four categories.
Building Scaled Picture Graphs: 3.MD.3

By TenMarks Amazon
Students learn the parts of a picture graph to build scaled picture graphs based on given data.
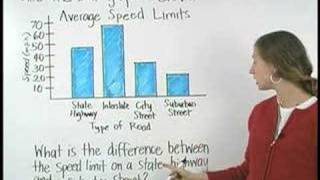
Bar Graphs- Pre Algebra Help
By yourteachermathhelp
Students learn that a bar graph is a visual way to display and compare numerical data (such as the population of different southern states). The bars of a bar graph are drawn in relation to a horizontal axis and a vertical axis and a bar graph can have either vertical or horizontal bars. Students are then asked to create bar graphs using given data and answer questions based on given bar graphs.
Box and Whisker Plots : Skewness and Outliers. : ExamSolutions

By ExamSolutions
Youtube Presents Box and Whisker Plots : Skewness and Outliers. : ExamSolutions an educational video resources on statistics.
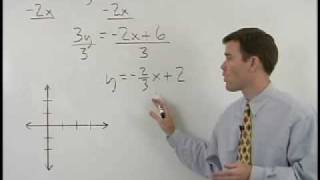
Difference of Two Cubes | MathHelp.com

By MathHelp.com
To solve the given system of inequalities, we start by graphing the associated equation for each inequality. In other words, we graph y equals -1/5 x +1 and y equals 3x + 2. So, for the first inequality, we start with our y-intercept of positive 1, up 1 unit on the y-axis. From there, we take our slope of -1/5, so we go down 1 and to the right 5, and plot a second point. Now, notice that our inequality uses a “less than” sign. This means that we draw a dotted line connecting the points, rather than a solid line. It’s important to understand that if we have a greater than sign or a less than sign, we use a dotted line, and if we have a greater than or equal to sign or a less than or equal to sign, we use a solid line. Pay close attention to this idea when drawing your lines. Students often carelessly use a solid line when they should use a dotted one, and vice-versa. Next, let’s take a look at our second inequality, which has a y-intercept of positive 2, up 2 units on the y-axis. From there, we take our slope of 3, or 3 over 1, so we go up 3 and to the right 1, and plot a second point. And notice that this inequality uses a “greater than or equal to” sign, so we connect the points with a solid line, rather than a dotted line. Next, we need to determine which side of each of these lines to shade on the graph. To determine which side of our first line to shade, we use a test point on either side of the first line. The easiest test point to use is (0, 0), so we plug a zero into our first inequality for both x and y, and we have 0 is less than -1/5 times 0 + 1, which simplifies to 0 is less than 0 + 1, or 0 is less than 1. Notice that 0 is less than 1 is a true statement. This means that our test point, (0, 0), is a solution to the first inequality, so we shade in the direction of (0, 0) along our first boundary line. Next, we determine which side of our second line to shade by using a test point on either side of the second line, such as (0, 0). Plugging a zero into our second inequality for both x and y, we have 0 equal to 3 times 0 + 2, which simplifies to 0 equal to 0 + 2, or 0 equal to 2. Notice that 0 equal to 2 is a false statement. This means that our test point, (0, 0), is a not solution to the inequality, so we shade away from (0, 0) along our second boundary line. Finally, it’s important to understand that the solution to this system of inequalities is represented by the part of the graph where the two shaded regions overlap, which in this case is in the lower left. In other words, any point that lies in this part of the graph is a solution to the given system of inequalities. Note that the points along the dotted boundary line of this region are not solutions to the system, but the points along the solid boundary line of this region are solutions to the system.

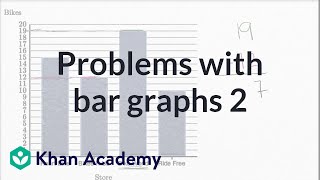
More solving problems with bar graphs | Fractions | 3rd grade

By Khan Academy
Interpret bar graphs to answer questions about a context.

Plot and Subplots: Creative Fiction Writing

By Cy Porter
Find and map out the plot and all the subplots in your story. Work on them separately to improve your story. It's better to look at each subplot separated from the rest of the story. Use subplot to make three dimensional characters.
[4.MD.4-1.0] Fractional Line Plots - Common Core Standard
By Freckle education
Make a line plot to display a data set of measurements in fractions of a unit (1/2, 1/4, 1/8)

Ex: Matching Correlation Coefficients to Scatter Plots

By Mathispower4u
Ex: Matching Correlation Coefficients to Scatter Plots
Stem and Leaf Plots in Statistics

By mathtutordvd
In this lesson, you'll learn what a stem-and-leaf plot is in statistics is and why it is important.