Lumos Video Store
This page provides a list of educational videos related to Data Sets. You can also use this page to find sample questions, apps, worksheets, lessons , infographics and presentations related to Data Sets.
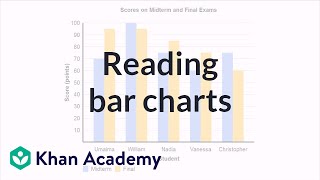
Reading bar charts: comparing two sets of data
By Khan Academy
A bar chart is especially useful with comparing two sets of data. The difference in the bars give us a quick snapshot that allows us to draw some conclusions.
Linear Correlation Coefficient from a set of data

By Diane R Koenig
This video shows the formula and calculation to find r, the linear correlation coefficient from a set of data.
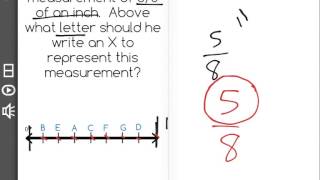
[4.MD.4-1.0] Fractional Line Plots - Common Core Standard
By Freckle education
Make a line plot to display a data set of measurements in fractions of a unit (1/2, 1/4, 1/8)
6.SP.5.a - Report the Number of Observations in a Data Set

By MathwithMrAlmeida
In this video, Mr. Almeida explains how to report the number of observations, or the n, in a data set. This is very important, as it is the foundation for being able to find statistical measures such as mean and mean absolute deviation. This address Common Core Standards for Mathematics indicator 6.SP.5.a.


Range, variance and standard deviation as measures of dispersion
By Khan Academy
This video goes over the main ways we measure dispersion of data, then shows those vlaues for two different data sets. Remember that simply comparing the means or medians of two data sets is not sufficient to fully compare the data. Understanding how data is arranged about the "center" of the data is also critical in understand and comparing the sets
The Measures of Central Tendency Rap
By Paul Devoto
Watch this rap to help yourself remember the measures of central tendency for a set of data. For different data sets, one measure maybe a better representation of the "center" of the data than another. This must be determined based on the spread and availability of the data.
Discrete vs. Continuous Relations - YouTube

By KeeperOfPhi
Looking at the differences between Discrete & Continuous relations (data sets)

[3.MD.3-1.0] Visual Representations of Data - Common Core Standard

By Freckle education
Draw a scaled bar graph to represent a data set with several categories
[2.MD.10-1.0] Picture and Bar Graphs - Common Core Standard

By Freckle education
Draw a picture graph and bar graph (with single-unit scale) to represent a data set with up to four categories.
Effects of shifting, adding, and removing a data point

By Khan Academy
Sal thinks through the effects of modifying a value in a data set. What will happen to the mean and median?
Effects of shifting, adding, and removing a data point

By Khan Academy
Sal thinks through the effects of removing a low outlier from a data set. What will happen to the mean and median?
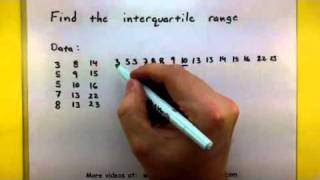
Statistics - Compute the interquartile range
By MySecretMathTutor
This video shows how to compute the interquartile range for a set of data. Remember to reorganize the data so that you can find the median values easier. For more videos visit http://mysecretmathtutor.com
Statistics - Compute the interquartile range
By MySecretMathTutor
This video shows how to compute the interquartile range for a set of data. Remember to reorganize the data so that you can find the median values easier. For more videos visit http://mysecretmathtutor.com

Solving problems with line plots 1
By Khan Academy
Create a line plot from a set of data. ������������Use the line plot to answer questions.