Interpreting graphs of linear and nonlinear functions - By Khan Academy
| 00:0 |
DESCRIPTION:
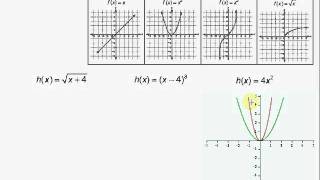
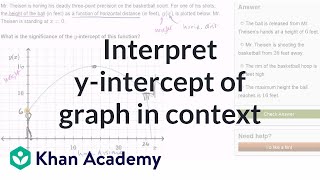
Interpreting graphs of linear and nonlinear functions
OVERVIEW:
Interpreting graphs of linear and nonlinear functions is a free educational video by Khan Academy.It helps students in grades 9,10,11,12 practice the following standards HSF.IF.B.4.
This page not only allows students and teachers view Interpreting graphs of linear and nonlinear functions but also find engaging Sample Questions, Apps, Pins, Worksheets, Books related to the following topics.
1. HSF.IF.B.4 : For a function that models a relationship between two quantities, interpret key features of graphs and tables in terms of the quantities, and sketch graphs showing key features given a verbal description of the relationship. Key features include: intercepts; intervals where the function is increasing, decreasing, positive, or negative; relative maximums and minimums; symmetries; end behavior; and periodicity..

")
 & Least Common Multiple (LCM) - [7]")

 - Part 1 (3rd Grade Math & 4th Grade Math)")