Ways to Represent Data - By EducationCommonsRW
Transcript
| 00:0 |
Summarizer
DESCRIPTION:
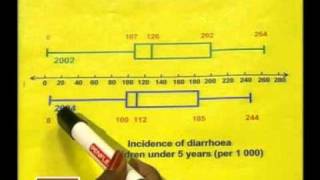
This is the second lesson in the series, "Data Handling." The video demonstrates how to compare data using box and whisker plots and how to decide the most appropriate way to represent data graphically.
OVERVIEW:
Ways to Represent Data is a free educational video by EducationCommonsRW.It helps students in grades 9,10,11,12 practice the following standards HSS.ID.A.1.
This page not only allows students and teachers view Ways to Represent Data but also find engaging Sample Questions, Apps, Pins, Worksheets, Books related to the following topics.
1. HSS.ID.A.1 : Represent data with plots on the real number line (dot plots, histograms, and box plots)..
GRADES:
9
10
11
12
STANDARDS:
HSS.ID.A.1

")
 & Least Common Multiple (LCM) - [7]")

 - Part 1 (3rd Grade Math & 4th Grade Math)")