Get Full Access to Lumos StepUp High School Integrated Mathematics 1 - Workbooks and Online Assessments
Currently, you have limited access to Lumos StepUp High School Integrated Mathematics 1 - Workbooks and Online Assessments. The Full Program includes,
Buy ACTASPIRE Practice Resources
 Online Program
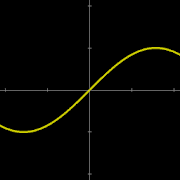
The line graph below shows the number of people at a festival from the time the gate opened until 10 hours later. What does the value 6 on the y-axis represent?
The x-axis shows "hours since opening" and the y-axis shows "number of people at the festival (hundreds)"


Give Your List Name
Word List
