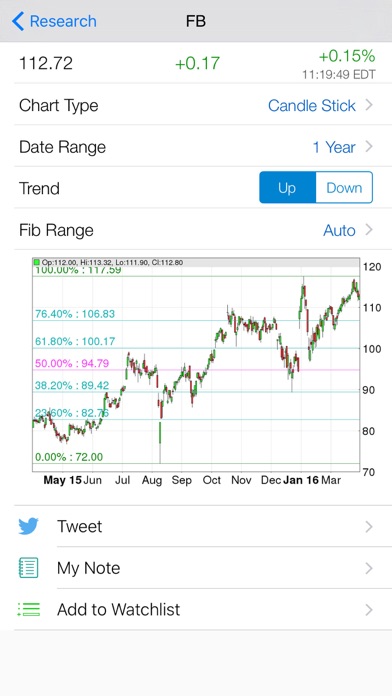
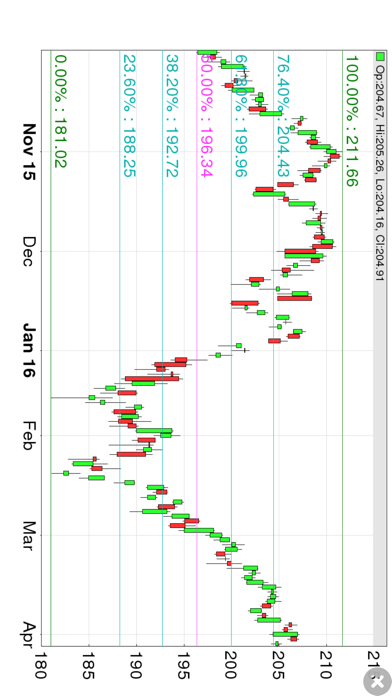
Fibonacci is very powerful. Traders never forget to check Fibonacci retracement chart before any swing trade. This app is a handy tool to quickly draw the Fibonacci lines on the chart based on the time range and direction (uptrend or downtrend) you choose. The lines are drawn automatically. You can certainly set your own range as well. All come with Real Time Advanced quotes (pre and after market quotes included), powerful Multi Chart View & Sector View, customized watch-list, stock notes, etc.
Fibonacci retracement on Stock Chart has never become this easy! Just enter the ticker symbol (or a
Fibonacci is very powerful. Traders never forget to check Fibonacci retracement chart before any swing trade. This app is a handy tool to quickly draw the Fibonacci lines on the chart based on the time range and direction (uptrend or downtrend) you choose. The lines are drawn automatically. You can certainly set your own range as well. All come with Real Time Advanced quotes (pre and after market quotes included), powerful Multi Chart View & Sector View, customized watch-list, stock notes, etc.
Fibonacci retracement on Stock Chart has never become this easy! Just enter the ticker symbol (or a partial symbol) you desire and bingo! you are there! A neat stock chart with Fibonacci lines and various Chart Types and Date Ranges is specially presented. Choose different type, date range, Fibonacci trend & range, you will have a better read / analysis on your stock. Tap the chart to view an enlarged full screen chart.
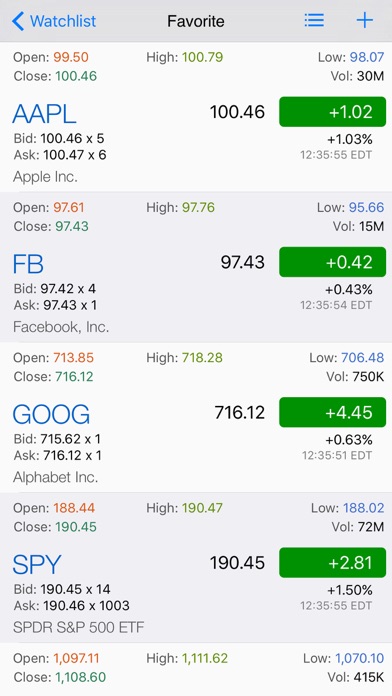
What's more, this app offers a very nice watch-list feature. You can create and manage unlimited watch-lists. The powerful watch-lists allow to group contents into Charted Sector View and exhibit a LIST of fully customized Charts (Multi-Chart View)! Adjust the technical indicator, chart type, and date range for the Multi Chart View and the app will automatically remember your settings. Create, modify, rename, sort, and delete watch-lists within seconds. With one glance, not only can you get the whole picture like change, change %, bid, ask, bid size, ask size, OHLC, volume, company, etc, but also quickly access the fibonacci lines / charts from there. Watch-list is so convenient that your market watching and researching become well organized and efficient.
FIBONACCI CHART
———————————
■ Fibonaaci
▫ Uptrend
▫ Downtrend
▫ Auto Range
▫ Customized Range
■ Real-Time Advanced Quotes
■ Pre and After Market Quotes
■ Various Chart Types.
■ Various Date Range, pre-set and customized.
WATCH-LIST & RESEARCH
——————————————
■ Unlimited watchlist groups with colorful tags
■ Real Time Advanced quotes (change, change %, bid, ask, bid size, ask size, open, high, low, close, volume, company).
■ Pre and After market quotes
■ Auto Refresh Quotes
■ Stock Multi Chart View 40+ Technical Indicator, Chart Type, & Date Range
■ Add multiple stock symbols at one time.
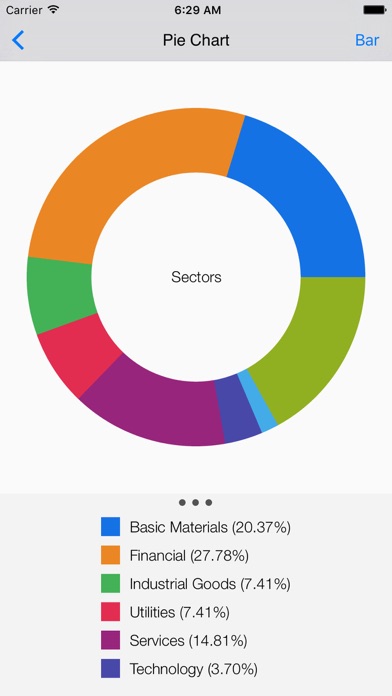
■ Group watchlist symbols into Sectors and Pie Chart.
■ Multi Chart View (up to 50 charts) of stocks.
■ Stock Notes
■ Passcode / Touch ID protected app access
TECHNICAL INDICATOR
——————————————
■ Accumulation/Distribution
■ Aroon Up/Down
■ Average True Range
■ Bollinger Band Width
■ Chaikin Money Flow / Oscillator / Volatility
■ Donchian Channel Width
■ Ease of Movement
■ Fast Stochastic
■ MACD
■ Money Flow Index
■ On Balance Volume
■ Performance
■ % Price / Volume Oscillator
■ Price Volume Trend
■ RSI / StochRSI
■ TRIX
■ Volume
■ and MANY MORE...
CHART TYPE
———————
■ Candle Stick
■ Based on close price
■ OHLC (open, high, low, close)
■ Based on typical price
■ Based on weighted close price
■ Based on median price
DATE RANGE
———————
■ Past 5,4,3,2 day & current day.
■ Daily chart supports 1-month, 2-month, 6-month, YTD, 1-5 years & MAX available date range.
■ Daily chart also supports customized date range: choose any date range from the calendar.
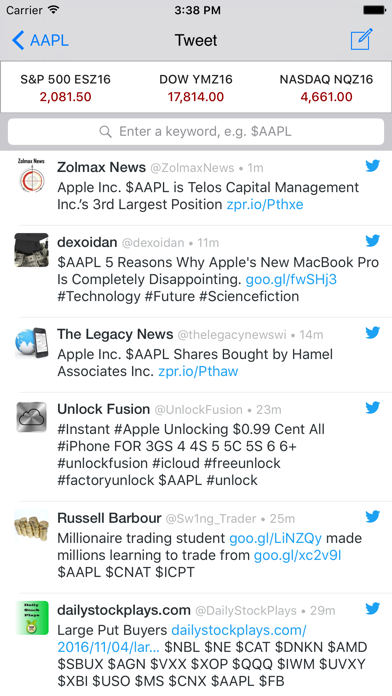
You can communicate with us through the In-App messaging system or to appsupport@mobileinteractive.com
OVERVIEW:
Fibonacci Stock Chart - trading signal in stocks is a free educational mobile app By Mobile Interactive LLC.It helps students practice the following standards .
This page not only allows students and teachers download Fibonacci Stock Chart - trading signal in stocks but also find engaging Sample Questions, Videos, Pins, Worksheets, Books related to the following topics.