assignment_returnWorksheet:
Graphs And Charts
Standard(s): 6.SP.B.4

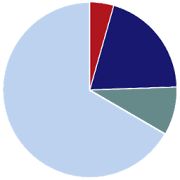
Which of the following graphs best represents the values in this table?


Standard: 6.SP.B.4
Domain: Statistics & Probability
Theme: Summarize and describe distributions
Description: Display numerical data in plots on a number line, including dot plots, histograms, and box plots.
The results of the class' most recent science test are displayed in this histogram. Use the results to answer the question. A "passing" score is 61 or higher.
How many students passed the science test?

3 students
20 students
23 students
25 students
Standard: 6.SP.B.4
Domain: Statistics & Probability
Theme: Summarize and describe distributions
Description: Display numerical data in plots on a number line, including dot plots, histograms, and box plots.
Which of the following graphs best represents the values in this table?

Standard: 6.SP.B.4
Domain: Statistics & Probability
Theme: Summarize and describe distributions
Description: Display numerical data in plots on a number line, including dot plots, histograms, and box plots.
Which of the following graphs best represents the values in this table?

Standard: 6.SP.B.4
Domain: Statistics & Probability
Theme: Summarize and describe distributions
Description: Display numerical data in plots on a number line, including dot plots, histograms, and box plots.
As part of their weather unit, the students in Mr. Green's class prepared a line graph showing the high and low temperatures recorded each day during a one-week period. Use the graph to answer the question.
Between which two days did the high temperature decrease while the low temperature increased?

Sunday and Monday
Monday and Tuesday
Tuesday and Wednesday
Friday and Saturday