Lumos Video Store
This page provides a list of educational videos related to Use Bar Graphs. You can also use this page to find sample questions, apps, worksheets, lessons , infographics and presentations related to Use Bar Graphs.
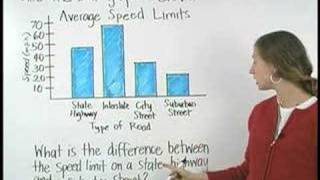
Bar Graphs- Pre Algebra Help
By yourteachermathhelp
Students learn that a bar graph is a visual way to display and compare numerical data (such as the population of different southern states). The bars of a bar graph are drawn in relation to a horizontal axis and a vertical axis and a bar graph can have either vertical or horizontal bars. Students are then asked to create bar graphs using given data and answer questions based on given bar graphs.
When to Use Bar Charts. Episode 1. Which Chart Or Graph Is Right for You?

By Tableau Software
Transforming data into an effective visualization (any kind of chart or graph) is the first step towards making your data work for you. In this video learn best practices for using a bar chart.
[2.MD.10-1.0] Picture and Bar Graphs - Common Core Standard

By Freckle education
Draw a picture graph and bar graph (with single-unit scale) to represent a data set with up to four categories.
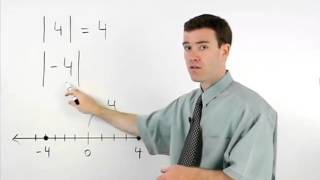
Absolute Value | MathHelp.com
By MathHelp.com
This lesson covers histograms. Students learn that a histogram is a type of bar graph that shows the frequency of data in various intervals (such as the number of residents in a given neighborhood that are age 21-30, age 31-40, and so on). Note that the difference between a histogram and a bar graph is that in a histogram, the data is organized into intervals. Students are then asked to create histograms using given data, and answer questions based on given histograms.
Graphs for 2nd grade - pictograph and bar graph
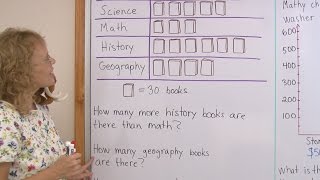
By mathmamoth
a pictograph (or a pictogram) and a bar graph. The pictograph has to do with books in a library, and one symbol of a 'book' means 30 books.
graphs and data line plot -"dot plots"

By Joann's School
Learn how to read and create a Line Plot (Dot Plot)
Building Scaled Picture Graphs: 3.MD.3

By TenMarks Amazon
Students learn the parts of a picture graph to build scaled picture graphs based on given data.
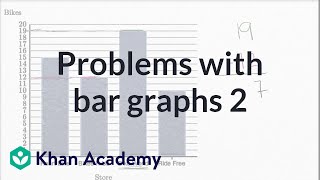
More solving problems with bar graphs | Fractions | 3rd grade

By Khan Academy
Interpret bar graphs to answer questions about a context.
Histograms | MathHelp.com

By MathHelp.com
MathHelp.com offers comprehensive math tutoring for students using McGraw-Hill math textbooks. Simply select your textbook, enter your page number, and get the exact lesson you need - with a teacher!
Understanding Measurement Data Displayed in Line Plots: 2.MD.9

By Tenmarks Amazon
Students learn how to interpret measurement data displayed in line plots.
Statistics: Parallel Boxplots (Univariate Data)

By Educator
Watch more at http://www.educator.com/mathematics/statistics/yates/ Other subjects include Calculus, Biology, Chemistry, Physics, Algebra 1/2, Basic Math, Trigonometry, Pre-Calculus, Geometry, Pre-Algebra, Organic Chemistry, and Computer Science. -All lectures are broken down by individual topics -No more wasted time -Just search and jump directly to the answer


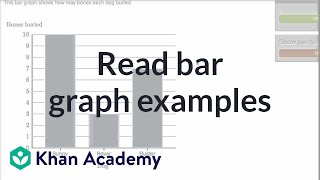
Reading pictographs
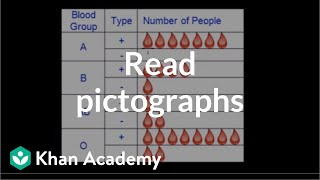
By Khan Academy
Common sense tells you that a pictograph must be some kind of....picture. Yes! A pictograph is basically a way to represent data with pictures that relate to the data. Let's look at this word problem that asks to interpret a pictograph.
Grade 3 Math - Graphs

By Lumos Learning
Using the Lumos Study Programs, parents and educators can reinforce the classroom learning experience for children and help them succeed at school and on the standardized tests. Lumos books, dvd, eLearning and tutoring are used by leading schools, libraries and thousands of parents to supplement classroom learning and improve student achievement in the standardized tests.
Introduction to line plots | Measurement and data | Early Math | Khan Academy
By KhanAcademy
Explanation about line plots
