Lumos Video Store
This page provides a list of educational videos related to Measures of Variability. You can also use this page to find sample questions, apps, worksheets, lessons , infographics and presentations related to Measures of Variability.
[6.SP.5d-1.0] Best Measure of Center and Variability - Common Core Standard

By Freckle by Renaissance
Summarize numerical data sets in relation to their context by relating the choice of measures of center and variability to the shape of the data distribution Front Row is a free, adaptive, Common Core aligned math program for teachers and students in kindergarten through eighth grade. Front Row allows students to practice math at their own pace - learning advanced concepts when they're ready and receiving remediation when they struggle. Front Row provides teachers with access to a detailed data dashboard and weekly email reports that show which standards are causing students difficulty, what small groups can be formed for interventions, and how their students are progressing in math.
[6.SP.5d-1.1] Best Measure of Center and Variability - Common Core Standard

By Freckle by Renaissance
Students must explain which measure of center is best to interpret the numerical data in the context of its collection Front Row is a free, adaptive, Common Core aligned math program for teachers and students in kindergarten through eighth grade. Front Row allows students to practice math at their own pace - learning advanced concepts when they're ready and receiving remediation when they struggle. Front Row provides teachers with access to a detailed data dashboard and weekly email reports that show which standards are causing students difficulty, what small groups can be formed for interventions, and how their students are progressing in math.
[7.SP.3-2.0] Assessing Data Overlap - Common Core Standard

By Front Row
Discover more Common Core Math at https://www.frontrowed.com Measure the difference between the centers of two numerical data distributions with similar variabilities by expressing it as a multiple of a measure of variability Front Row is a free, adaptive, Common Core aligned math program for teachers and students in kindergarten through eighth grade. Front Row allows students to practice math at their own pace - learning advanced concepts when they're ready and receiving remediation when they struggle. Front Row provides teachers with access to a detailed data dashboard and weekly email reports that show which standards are causing students difficulty, what small groups can be formed for interventions, and how their students are progressing in math. Discover more Common Core Math at https://www.frontrowed.com

Introduction to Random Variables - Khan Academy
By Khan Academy
This video lecture series from Khan Academy on Probability includes Introduction to Probability Permutations Combinations Probability using Combinations Conditional probability Introduction to Random Variables Probability Density Functions Binomial Distribution Expected Value Expected value of Binomial Distribution Poisson Process Law of Large Numbers.....
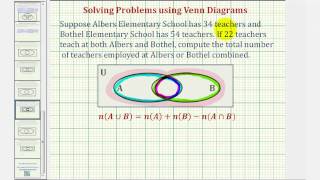
Ex 2: Set Problem Solving - Find the Number of Element in the Union of Two Sets Using a Formula
By Mathispower4u
Ex 2: Set Problem Solving - Find the Number of Element in the Union of Two Sets Using a Formula
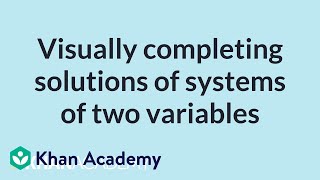
Constraint solution sets of systems of linear inequalities
By Khan Academy
Given the graph of a system of inequalities, Sal finds the x-values that make the ordered pair (x,-2) a solution of the system, which is the solution set constrained to y=-2. Then he solves a similar problem where x is constrained to 4.
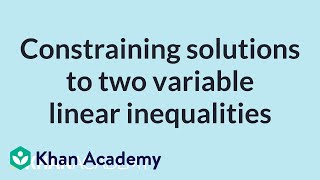
Constraint solution sets of two-variable linear inequalities
By Khan Academy
Sal determines which x-values make the ordered pair (x,-7) a solution of 2x-7y<25. He also solves a similar problem where the inequality is given as a graph.

12 - What are Vectors and Scalars?

By Math and Science
Quality Math And Science Videos that feature step-by-step example problems!
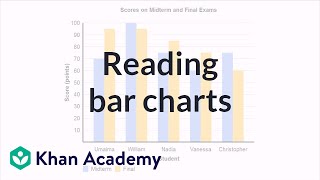
Reading bar charts: comparing two sets of data
By Khan Academy
A bar chart is especially useful with comparing two sets of data. The difference in the bars give us a quick snapshot that allows us to draw some conclusions.
07 - Trig Functions of Acute Angles - (Sin, Cos, Tan, Cot, Sec & Csc Theta) - Part 1 - Trig Ratios

By Math and Science
Quality Math And Science Videos that feature step-by-step example problems!
01 - The Distance Formula, Pythagorean Theorem & Midpoint Formula - Part 1 (Calculate Distance)
By Math and Science
Quality Math And Science Videos that feature step-by-step example problems!
10 - What are Imaginary Numbers?
By Math and Science
Quality Math And Science Videos that feature step-by-step example problems!
15 - What is a Logarithm (Log x) Function? (Calculate Logs, Applications, Log Bases)

By Math and Science
Quality Math And Science Videos that feature step-by-step example problems!
06 - Review of Essential Trigonometry (Sin, Cos, Tangent - Trig Identities & Functions)
By Math and Science
Quality Math And Science Videos that feature step-by-step example problems!
ICTS Big Questions: A Journey into the Quantum Universe with Subir Sachdev

By International Centre for Theoretical Sciences
Autism: An evolutionary perspective, Professor Simon Baron-Cohen, 1st Symposium of EPSIG, 2016

By Lumos Learning
First Symposium of the Evolutionary Psychiatry Special Interest Group of the Royal College of Psychiatrists, Oct 4th 2016 in London. Lecture by Professor Simon Baron-Cohen from Cambridge University Autism Research Centre.