Lumos Video Store
This page provides a list of educational videos related to Graphs and Charts. You can also use this page to find sample questions, apps, worksheets, lessons , infographics and presentations related to Graphs and Charts.
Charts Maps and Graphs: Finding Treasure - YouTube

By sedl
Charts Maps and Graphs: Finding Treasure - YouTube
When to Use Bar Charts. Episode 1. Which Chart Or Graph Is Right for You?

By Tableau Software
Transforming data into an effective visualization (any kind of chart or graph) is the first step towards making your data work for you. In this video learn best practices for using a bar chart.

Reading Pie Graphs (Circle Graphs) - Khan Academy

By Khan Academy
While pie charts (or circle graphs) are often easy to read they are more difficult to put into percentages since that usually involves fractions. When used to initially teach fractions this process usually is a bit easier. Use the easy to understand video in this learning to explain to students how to read pie charts (circle graphs).
eSpark Learning: Nonfiction Text Features Instructional Video (4.RI.7)

By eSparkLearningVideos
This video introduces several text features such as charts, graphs, and maps. It gives an example of a diagram in a text about the food chain. This diagram helps readers understand the information in the text.
eSpark Learning: Nonfiction Text Features Instructional Video (4.RI.7)
By eSparkLearningVideos
This eSpark video outlines a new learning Quest that will help students master Common Core Standard 4.RI.7: Interpret information presented visually, orally, or quantitatively (e.g., in charts, graphs, diagrams, time lines, animations, or interactive elements on Web pages) and explain how the information contributes to an understanding of the text in which it appears.
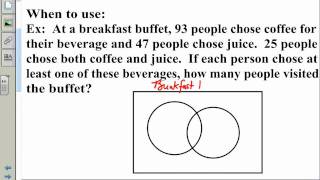
Using Venn Diagrams to Solve Word Problems
By TeacherTube Math
The instructor shows how and when to use Venn Diagrams to solve word problems. He uses an interactive whiteboard to demonstrate the word problem that can be solved with Venn Diagrams. Urges students to label their charts and graphs. Teacher teaches clearly and provides good models.
eSpark Learning: Nonfiction Text Features Instructional Video (4.RI.7)
By eSparkLearningVideos
This eSpark video outlines a new learning Quest that will help students master Common Core Standard 4.RI.7: Interpret information presented visually, orally, or quantitatively (e.g., in charts, graphs, diagrams, time lines, animations, or interactive elements on Web pages) and explain how the information contributes to an understanding of the text in which it appears.
Inverse Relations | MathHelp.com
By MathHelp.com
Here we’re asked to solve for x in the equation: log base x of 144 = 2. Notice that we have a logarithmic equation, so let’s first convert the equation to exponential form. Remember that the base of the log represents the base of the power, the right side of the equation represents the exponent, and the number inside the log represents the result, so we have x…squared…= 144. Now, to solve for x, since x is squared, we simply take the square root of both sides of the equation to get x = plus or minus 12. Remember to always use plus or minus when taking the square root of both sides of an equation. However, notice that x represents the base of the logarithm in the original problem, and the base of a logarithm cannot be negative. Therefore, x cannot be equal to negative 12. So our final answer is x = 12.
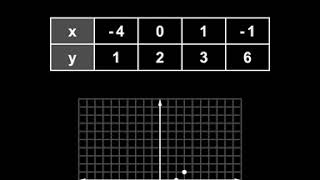
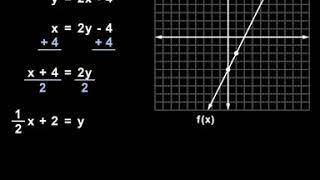
Inverse Functions | MathHelp.com
By MathHelp.com
In this example, we’re given a relation in the form of a chart, and we’re asked to find the inverse of the relation, then graph the relation and its inverse. To find the inverse of a relation, we simply switch the x and y values in each point. In other words, the point (1, -4) becomes (-4, 1), the point (2, 0) becomes (0, 2), the point (3, 1) becomes (1, 3), and the point (6, -1) becomes (-1, 6). Next, we’re asked to graph the relation and its inverse, so let’s first graph the relation. Notice that the relation contains the points (1, -4,), (2, 0), (3, 1), and (6, -1). And the inverse of the relation contains the points (-4, 1), (0, 2), (1, 3), and (-1, 6). Finally, it’s important to understand the following relationship between the graph of a relation and its inverse. If we draw a diagonal line through the coordinate system, which is the line that has the equation y = x, notice that the relation and its inverse are mirror images of each other in this line. In other words, the inverse of a relation is the reflection of the original relation in the line y = x.
Positive and negative intervals

By Khan Academy
Sal gives several example of graphs where he highlights positive or negative intervals of the function.
Positive and negative intervals
By Khan Academy
Sal gives several example of graphs where he highlights positive or negative intervals of the function.
Positive and negative intervals
By Khan Academy
Sal gives several example of graphs where he highlights positive or negative intervals of the function.
Positive and negative intervals
By Khan Academy
Sal gives several example of graphs where he highlights positive or negative intervals of the function.
Interpreting graphs word problems
By Khan Academy
Sal considers the graph of a function that models temperature over time, and matches features of that graph to their real-world meaning.
Match graphs of rational functions to their formula
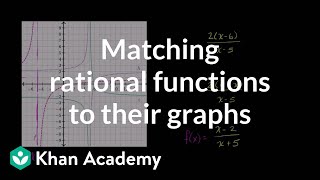
By Khan Academy
Sal matches three graphs of rational functions to three formulas of such functions by considering asymptotes and intercepts.
Graphs of piecewise linear functions

By Khan Academy
Sal explains what a piecewise function is, and finds the formula of a piecewise function given its graph.
Interpreting graphs word problems
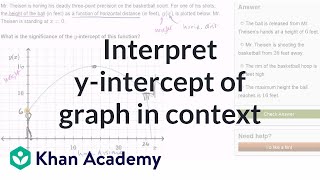
By Khan Academy
Sal discusses the meaning of the y-intercept of the graph of a function that models the height of a ball.
Graphs of piecewise linear functions
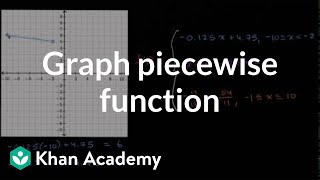
By Khan Academy
Sal graphs a piecewise function given its formula. In this case, the function consists of three separate lines.
