Lumos Video Store
This page provides a list of educational videos related to Graphing Linear Functions. You can also use this page to find sample questions, apps, worksheets, lessons , infographics and presentations related to Graphing Linear Functions.
Interpreting graphs of linear and nonlinear functions
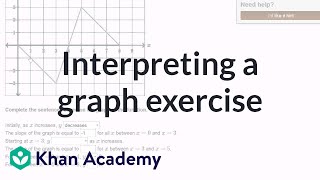
By Khan Academy
Interpreting graphs of linear and nonlinear functions
Using the x- and y- Intercepts to Graph a Linear Function
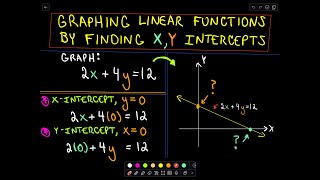
By PatrickJMT
This video shows us how to use two important features of a linear function, the x- and y- intercepts, to graph the function. Remember that we only need two points to determine a line, and often, the intercepts are extremely easy to find.
Using the x- and y- Intercepts to Graph a Linear Function
By PatrickJMT
This video shows us how to use two important features of a linear function the x- and y- intercepts to graph the function. Remember that we only need two points to determine a line and often the intercepts are extremely easy to find.
Graphs of piecewise linear functions
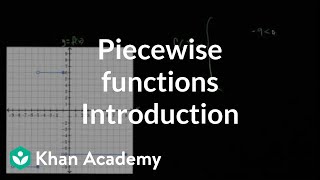
By Khan Academy
Sal explains what a piecewise function is, and finds the formula of a piecewise function given its graph.
Graphs of piecewise linear functions
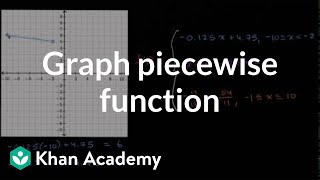
By Khan Academy
Sal graphs a piecewise function given its formula. In this case, the function consists of three separate lines.
Comparing linear functions
By Khan Academy
Sal is given a table of values of a linear function and four linear graphs, and is asked to determine which graph increases faster than the function represented in the table.
Comparing linear functions
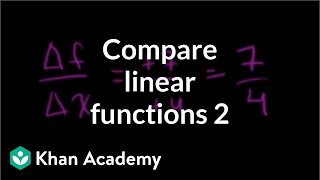
By Khan Academy
Sal is given a table of values of a linear function and four linear graphs, and is asked to determine which graph has the same rate of change as the function represented in the table.
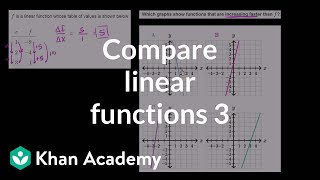
Comparing linear functions
By Khan Academy
Sal is given the formula of a linear function and the graph of another, and is asked to determine which function increases faster.
Graphs of linear equations | Linear equations and functions | 8th grade

By Khan Academy
A video that goes over graphing linear equations on the coordinate plane. The first part of the video starts with an equation with two variables, x and y. The instructor finds sample points and then plots them. Then, he moves on to some more complicated and conceptual problems.
Graphs of piecewise linear functions
By Khan Academy
Sal graphs a piecewise function given its formula. In this case, the function consists of three separate lines.
Graphs of piecewise linear functions
By Khan Academy
Sal graphs a piecewise function given its formula. In this case, the function consists of three separate lines.
Graphs of piecewise linear functions
By Khan Academy
Sal explains what a piecewise function is, and finds the formula of a piecewise function given its graph.
Graphs of piecewise linear functions
By Khan Academy
Sal explains what a piecewise function is, and finds the formula of a piecewise function given its graph.
Graphing linear functions word problems

By Khan Academy
Sal is given a verbal description of a real-world relationship involving a pool being filled with water, and is asked to draw the graph that represents this relationship.
Graphing linear functions word problems

By Khan Academy
Sal is given a verbal description of a real-world relationship involving a truck's fuel consumption, and is asked to draw the graph that represents this relationship.
Comparing linear functions
By Khan Academy
Sal is given a table of values of a linear function and four linear graphs, and is asked to determine which graph has the same rate of change as the function represented in the table.
Comparing linear functions
By Khan Academy
Sal is given a table of values of a linear function and four linear graphs, and is asked to determine which graph increases faster than the function represented in the table.
Graphing linear functions word problems
By Khan Academy
Sal is given a verbal description of a real-world relationship involving a pool being filled with water, and is asked to draw the graph that represents this relationship.
Graphing linear functions word problems
By Khan Academy
Sal is given a verbal description of a real-world relationship involving a pool being filled with water, and is asked to draw the graph that represents this relationship.
Graphing linear functions word problems
By Khan Academy
Sal is given a verbal description of a real-world relationship involving a pool being filled with water, and is asked to draw the graph that represents this relationship.